
Create and interpret cumulative frequency polygons
Ogives. What a funny word!

"Bonne-Esperance Salle capitulaire" by Jonathan Nélis / Wikimedia Commons. Licensed under CC BY-SA 3.0 via Commons - https://commons.wikimedia.org/wiki/File:Bonne-Esperance_Salle_capitulaire.JPG#/media/File:Bonne-Esperance_Salle_capitulaire.JPG
The curve of the Gothic arches pictured above is called an ogival arch. This is a word we also use in statistics in reference to the curved shape of the arch, and this curve is replicated with a normal distribution in a cumulative frequency polygon or ogive curve.
But if that's what an ogive is, then I hear you ask what is a cumulative frequency polygon? We already looked at histograms and polygons
Frequency Polygons
Frequency polygons are particularly useful for helping us understand the shapes of distributions and for comparing data sets. They are also a good way to display cumulative frequency distributions. A frequency polygon is a graph that makes a shape that looks like a polygon by joining the right-top points of the columns of a histogram, as shown below.
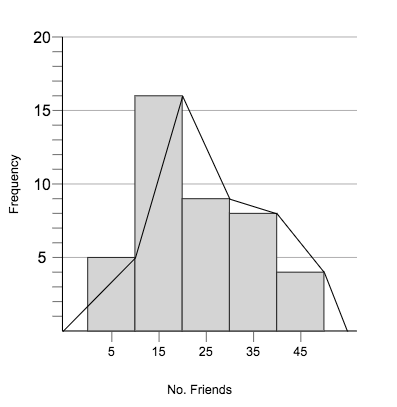
We can use frequency polygons to help us estimate how many people got a particular score. For example, the graph above shows that $8$8 people have between $30$30 and $40$40 friends.
Cumulative Frequency Histograms
We've looked at histograms as graphical representations of the distribution of data by plotting the frequencies of each individual score. In cumulative frequency histograms, we plot the cumulative frequency scores. As such, the columns in a cumulative frequency histogram continue to increase, with the largest columns having the largest score.
This is a graph of the same example from above set out as a cumulative frequency histogram.

Combining both polygons and cumulative frequency histograms, we get the cumulative frequency polygon.
Cumulative Frequency Polygon
This is a polygon that:
- starts at $0$0
- increases by the frequency of each class
- ends at the total sum of all scores
- is joined together by line segments
- can be superimposed on the cumulative frequency histogram, or can stand alone.
So adding the polygon to the cumulative frequency histogram above we would get this.

and without the histogram, just on its own

Worked Examples
Question 1
Question 2
Consider the data below of times taken to walk to the nearest park.
| Time (minutes) | Frequency |
|---|---|
| $0\le h<10$0≤h<10 | $5$5 |
| $10\le h<20$10≤h<20 | $5$5 |
| $20\le h<30$20≤h<30 | $20$20 |
| $30\le h<40$30≤h<40 | $25$25 |
| $40\le h<50$40≤h<50 | $5$5 |
Create a cumulative frequency polygon from this data.
Estimate the median from the graph to the nearest $10$10 minutes.
Estimate the upper and lower quartiles based off the graph.
Write both on the same line separated by a comma and to the nearest $10$10 minutes.
Estimate the interquartile range from the answers to part (c).
Give your answer to the nearest $10$10 minutes.
Question 3
The scores for a darts tournament are shown below.
| Class limits | Frequency |
|---|---|
| $202$202 - $204$204 | $5$5 |
| $205$205 - $207$207 | $8$8 |
| $208$208 - $210$210 | $17$17 |
| $211$211 - $213$213 | $28$28 |
| $214$214 - $216$216 | $17$17 |
| $217$217 - $219$219 | $3$3 |
Create a histogram and frequency polygon for this data.
Construct an ogive for this data.
Which of the following best describes the skewness of the distribution?
Positively skewed
ANegatively skewed
BSymmetrical
C