
Quantiles and Percentiles
We're now going to take a look at some specific terminology that is often used in the context of talking about scenarios that are modelled by a normal distribution.
What does it mean when you hear that someone is in the $98$98th percentile?
Have you ever completed a mathematics competition and when you receive your result you find that you were above the $0.85$0.85 quantile?
You know this is a good thing, but do you know what it means?
Percentiles
As the name suggests, percentiles split an ordered set of data into one hundred parts, where each percentile indicates the proportion of the population below that value.
Let’s think about the height of female adults. If the $45$45th percentile height is $155$155 cm, this means that $45%$45% of female adults are shorter than $155$155 cm.
We often see our test results expressed in this way: “You are placed in the $78$78th percentile”. But what does this mean?
If you are at the $78$78th percentile, then you performed better than $78%$78% of those who did the test.
But if you are in the $78$78th percentile, then you performed better than at least $78%$78% of those who did the test.
In the second case, we can say "at least" $78%$78% because you may have scored better than other students also in the $78$78th percentile. But in both cases your score is still below the percentiles above the $78$78th (i.e. the $79$79th, $80$80th, etc up to the $99$99th percentile). This is illustrated in the images below:

Let's zoom in to take a closer look at the percentile:

Note that the percentile is not the same as your actual score in the test. Rather it is a reflection of your rank in the ordered set of scores from all the participants.
Quantiles
A quantile is exactly like a percentile, but expressed as a decimal instead.
So for the situation above, where you're in the $45$45th percentile for your height, you would say you're in the $0.45$0.45 quantile.
If you're in the $94$94th percentile for your mathematics competition result, then you're in the $0.94$0.94 quantile.
Percentiles, Quantiles and the 68-95-99.7 Rule
example
The results of an IQ test are known to be normally distributed with a mean of $100$100 and a standard deviation of $10$10.
(a) What is the $84$84th percentile?
Think: We need to consider how many standard deviations above of below the mean indicates that an area of $84%$84% has been shaded on our normal distribution curve. Thinking about $84%$84%, we know this is made up of $50%$50% (half the curve) and $34%$34%. From our experience with the 68-95-99.7 rule, we know that $34%$34% means we have one standard deviation above the mean. We can sketch this on a graph.
Do:

From our graph, we can see that the $84$84th percentile is $110$110 on this IQ test.
(b) What is the lowest mark achieved by the $0.975$0.975 quantile?
Think: The lowest mark achieved by the $0.975$0.975 quantile is the same as the mark that is at the $0.975$0.975 quantile. Using similar reasoning as we did in part (a), we know that $0.975$0.975 is made up of $0.5$0.5 (half the curve) and $0.475$0.475 which is half of $0.95$0.95. Thus we're looking at the score that is two standard deviations above the mean. Again, a graph is useful here.
Do:

From our graph, we can see that the lowest mark achieved by the $0.975$0.975 quantile is $120$120 on the IQ test.
Quantiles and percentiles with CAS
Most of the time the quantiles and percentiles we're interested in don't fit nicely into our 68-95-99.7 Rule and we need to use the capabilities of our CAS calculators instead.
example
The heights of 16-year-old females are known to be normally distributed with a mean of $165$165 cm and a standard deviation of $2$2 cm.
(a) Calculate the height that $98%$98% of 16-year-old females fall below.
Think: Again it's useful to at least visualise a graph before turning to our CAS. The shaded region represents the proportion of 16-year-old females with height less than the $98$98th percentile.

Do: Use your CAS to find the height that $98%$98% of 16-year-old females fall below.
Casio ClassPad

So we can see that the height is $168$168 cm, rounded to the nearest cm.
TI-NSPIRE CAS
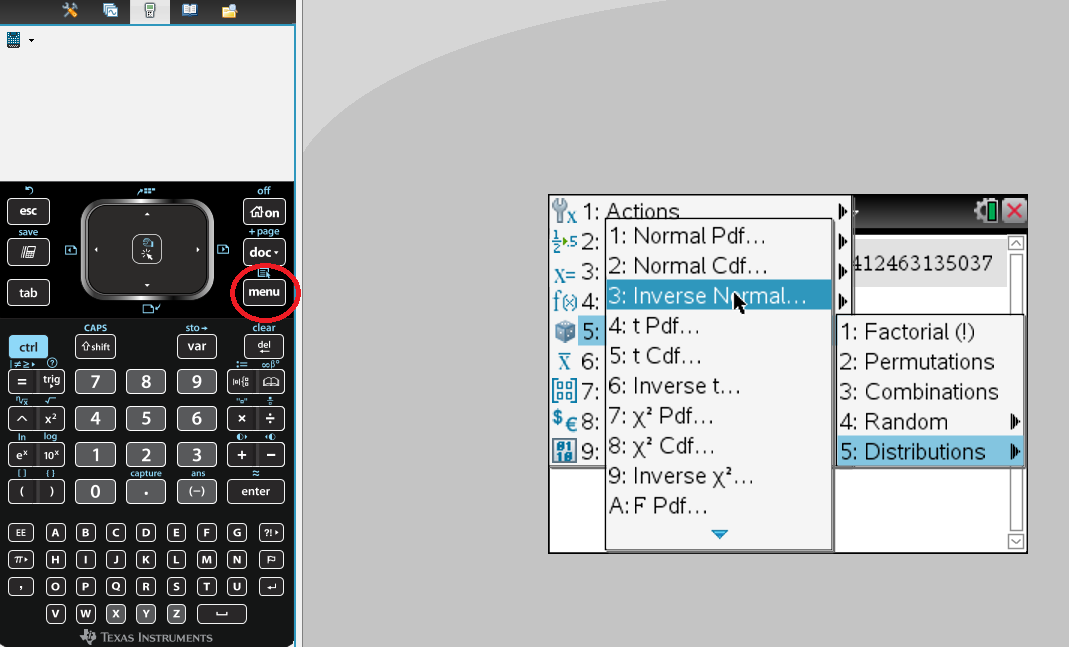
In the Calculator section of the TI-Nspire CAS Calculator, select Menu -> 5. Probability -> 5. Distributions -> 3. Inverse Normal.
The Inverse Normal function calculates the largest score of a (left-tail) normal distribution with a given area under the graph (e.g. the probability, between 0 and 1), as well as the curve's mean $\mu$μ and standard deviation $\sigma$σ.
So to calculate the height of the $98$98th percentile, you are inputting an area of $0.98$0.98, as well as the given mean $168$168 and standard deviation $2$2.

Press OK and you will get an answer of $168$168 cm, rounded to the nearest whole number. Alternatively, you could input the command $\text{InvNorm(0.98, 168, 2)}$InvNorm(0.98, 168, 2) directly into the calculator and get the same answer immediately.
(b) What is the height of the $0.4$0.4 quantile?
Think: We'll follow the same process of drawing a sketch and then using CAS to calculate. The shaded region represents the proportion of 16-year-old females with height less than the 0.4 quantile.
Do:

Casio ClassPad

So $40%$40% of 16-year-old girls are shorter than $163.5$163.5 cm.
TI-NSPIRE CAS
Remember that the $0.4$0.4 quantile is equal to the $40$40th percentile. So to calculate the lowest score in a quantile, you would use the same approach as before when calculating the lowest score in a percentile, except for area you would input the quantile value directly. In this case, you would input $0.4$0.4

Alternatively, you could input the command $\text{InvNorm(0.4, 168, 2)}$InvNorm(0.4, 168, 2) directly into the calculator and get an immediate answer of $163.5$163.5 cm, rounded to $1$1 decimal place, as the height of the girls at the $0.4$0.4 quantile.
Worked Example
QUESTION 1
Mensa is an organisation that only accepts members who score in the $98$98th percentile or above in an IQ test. What does this mean? Select all that apply.
To be accepted into Mensa, a person must score higher than $98%$98% on the IQ test.
ATo be accepted into Mensa, a person must score higher than $98%$98% of other people on the IQ test.
BA successful applicant’s IQ score will be among the top $2%$2% of the population.
CA successful applicant’s IQ score will be among the bottom $98%$98% of the population.
D