
Create and Interpret Parallel Dot Plots
Dot plots are a quick way to visually represent data. Just like dot plots, if you are considering a large data set it would be best to use another type of graph, but for fairly small size data sets parallel dot plots can help you to quickly see the spread of data and identify any outliers.
Parallel dot plots help you to compare two or more sets of data, which must be plotted against the same scale. This makes the comparison between the data sets easy and ensures it isn't misleading. For example, you cannot have one dot plot for the height of a group of people, and have a parallel dot plot for their weights as these would be in different units. They must be in the same unit and the same scale. When creating a parallel dot plot, it's also really important to make sure you take the time to make sure everything is lined up correctly!
Examples
question 1
A class was asked to complete $10$10 questions in Mathspace for homework.

a) Which group had the highest median?
Think: The median is the middle data point after the data has been ordered. As this data is already ordered you need to find the middle data point for both groups and compare them.
Do: Boys - there are $14$14 boys, so the median will be the average of the $7$7th and $8$8th data point. $\frac{8+10}{2}=9$8+102=9 minutes.
Girls - there are $15$15 girls, so the median data point will be the $8$8th data point. Count along to find the $8$8th point. The median is $7$7 minutes.
So the boys had the higher median.
b) Which group had the largest range?
Think: You need to calculate the range for each dot plot and then compare.
Do: for boys the range is $12-2=10$12−2=10. For girls the range is $12-2=10$12−2=10. The range is the same for both groups.
c) Who had the smallest mode? boys/girls
Think: The mode refers to most often. There can be more than one mode.
Do: Look to see where the graph is tallest.
Boys - $3$3 boys took $11$11 minutes.
Girls - $3$3 girls took $10$10 minutes.
The girls therefore had the smallest mode.
question 2
$20$20 people joined a weight loss class. When they first joined they had their weights measured each week. Their overall weight was plotted each week on a parallel dot plot.
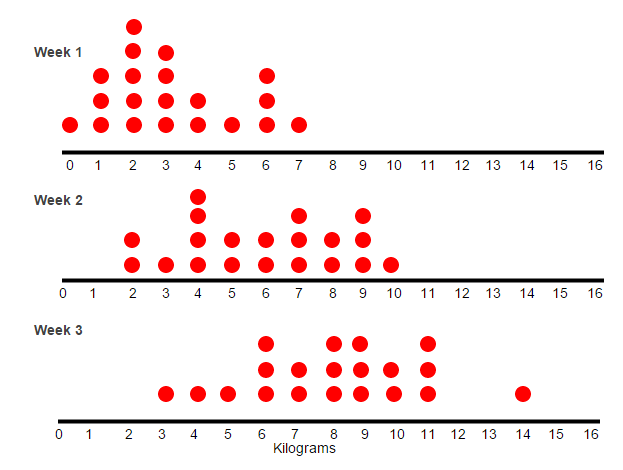
a) After $1$1 week, how has the median weight loss from when the class started?
Think: Make sure you are looking at the correct data set. The median is the middle data point of an ordered set of data.
Do: We know that there are $20$20 people in the class. Therefore the median is in the middle of the $10$10th and $11$11th data points.
$\frac{3+3}{2}=3$3+32=3 kilograms
b) After $2$2 weeks, what is the mean weight loss of the class since the class started?
Think: The mean is calculated by adding all the data points together and dividing by the number of data points. We already know there are $20$20 data points.
Do: $\frac{2+2+3+4+4+4+4+5+5+6+6+7+7+7+8+8+9+9+9+10}{20}$2+2+3+4+4+4+4+5+5+6+6+7+7+7+8+8+9+9+9+1020
= $5.95$5.95 kilograms
Question 3
A class completed $40$40 questions for homework.
The time needed for boys and girls to finish them was collected, and the data was presented as a parallel dot plot.

Comparing boys and girls, which gender had the highest median time?
Girls
ABoth medians are the same.
BBoys
CWhich gender had the largest range?
Boys
AGirls
BBoth ranges are the same.
CWhich group has the highest valued mode?
Boys
AGirls
BBoth modes are the same.
C
Question 4
Isabelle did an experiment to see how well plants grow in different conditions.
She had $8$8 plants grow in the sunshine, and $8$8 that grew in the shade. She measured how tall they grew in centimetres after $2$2 months, and recorded the information as a parallel dot plot.


Which group of plants had a higher range of heights?
The plants that grew in the shade.
AThe plants that grew in the sunshine.
BThe two groups of plants had the same height range.
CWhich dot plot shows a positive skew?
Shade
ANeither
BSunshine
CHow much higher is the median height of plants grown in the sunshine than the median height of plants grown in the shade?