
Comparisons from Experiments (Investigation)
Making sick people better is a very high-stakes game. You really want to make sure that what you're doing is beneficial, or it could cost someone their life. But how do doctors actually know what the best treatment for a medical condition is? How do they know that a particular treatment works?
The Problem With Authority and Observation
For nearly 2000 years, doctors used authority to decide what to do. They followed the teachings of the Ancient Greek "father of medicine" Hippocrates, whose theory of Humorism said that the treatment for just about any disease was to take as much of the patient's blood as possible. Whilst this might seem crazy to us, to the people at the time it seemed to work well: when they took a patient's blood and they got better, they thought it was proof that their treatment had worked, and when a patient died, they thought they must not have taken enough blood. This problem of selectively interpreting observations to support a theory is called confirmation bias, and is a problem in many scientific fields.
1. Can you think of any other situations where confirmation bias influences our beliefs?
The Problem With Simple Medical Trials
In order to overcome confirmation bias, you need objective trials of medical treatments, rather than ad-hoc observations. This means collecting a group of patients, giving them the treatment, and using mathematics to objectively analyse the results.
However, many simple medical trials have a serious problem, because of the "placebo effect". A "placebo" is a medication which looks like a real medication, but in fact does nothing at all. The "placebo effect" describes the fact that after taking a placebo, many people feel much better simply from the psychological effect of thinking that they are taking a medication. Therefore, if we just give a group of people a particular medicine, many people will seem to get better even if the medicine itself does not actually do anything for the disease.
2. Can you think of any other situations where the placebo effect might mislead people into thinking that something works?
3. If placebos are able to make people feel better, is it ethical to allow doctors to give people placebos as medicines?
Controlled Trials
In medical trials, we want to know that it is the medicine itself which is making the patient better, not a placebo effect, so all medical trials check to make sure that a positive result is not a placebo effect. They do this by having a second group of patients, called "controls" who are given a fake version of the medication containing only sugar. Therefore, these trials are called "controlled trials". In a controlled trial, the group which is being given the real treatment is compared with people who are given a fake treatment (placebo), to make sure that the effect of a treatment is actual due to the medicine itself.
Randomised Controlled Trials
When doing a controlled trial, it is very important to make sure that the decision of who gets placebo and who gets the real medicine is completely random. Otherwise, doctors might choose to always give the real medicine to the sicker patients. If they did this, then when comparing the results of the medicine to the placebo, it would look like the medicine made people sicker.
4. Should the doctors know who is getting placebo and who is getting the real medicine? Why or why not?
But Wait, There's Maths
So you do your randomised controlled trial, and you come up with some results. How do you actually make a decision about whether the treatment worked or not?
Let's say you're testing whether a medicine called metformin helps treat diabetes. In diabetes, there is a particular number called HbA1c, which reflects how well the blood sugars are being controlled. Generally speaking, the lower the number is, the better. You split 20 patients into two groups, with 10 receiving the medicine and 10 receiving placebo. You get the results back, and they look like this:
| Control | Treatment |
|---|---|
| 8.2 | 9.2 |
| 9.1 | 7.4 |
| 7.2 | 6.4 |
| 6.8 | 7.7 |
| 8.4 | 7.0 |
| 6.5 | 8.0 |
| 8.0 | 7.2 |
| 7.4 | 6.7 |
| 10.2 | 7.9 |
| 6.7 | 6.3 |
Well...did it work? Um...maybe? It's a bit confusing looking at the raw data. It's not as if everyone in the treatment group did better than the people in the control group, but overall they seem to be doing better. Unfortunately, "seem to be doing better" is a very inexact way of doing things, and we can easily be mislead. On top of this, what if the difference between the treatment and the control group are just due to chance? In other words, how do we make sure that this is not a fluke?
Well, that is where the maths comes in to it. And I have to warn you, the maths is...just awful. The calculations are very complex, and it takes many steps to get to the final result. As a result, this stuff is considered first year university level maths. Nonetheless, let's have a look:
We're going to use the "paired t-test", which allows us to judge the probability that two different groups of measurements come from the same population. It does this by comparing their mean and standard deviation, and using probability to figure out how likely it is that you would see these results by chance alone.
The first step for the t-test is to find the number of subjects in each group (which are abbreviated as n1 and n2), the means (which are abbreviated as X1 and X2, with a bar on top meaning average) and standard deviations for each of these populations. To calculate these, we could do it manually (see the formulas here), or use an online calculator or a spreadsheet function.
In any case, the answers are:
| Control | Treatment | |
|---|---|---|
| Number | 10 | 10 |
| Mean | 8.19 | 7.38 |
| Standard deviation | 1.12 | 0.87 |
But wait, that's just the beginning! Next, we plug those numbers into this formula to get the "pooled standard deviation", which is abbreviated as sX1X2:
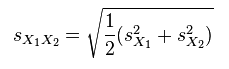
Wow, even the formula is hard to figure out. To decode this, we need to know that SX1 means the standard deviation of group 1, and SX2 means the standard deviation of group 2. And yes, those are squared signs above each of them.
Having fun yet? If you did the calculation right, you should get a value of approximately 1 (rounding is close enough for our purposes).
Your reward for finishing that calculation is that you get to use the value of SX1X2 into another cryptic formula:

In this case, the X with the bar on it means average, so the numerator is asking for the average of group 1 minus the average of group 2. SX1X2 is the answer for the previous calculation, and n is the number of people in each group (in our case, 10). Also, the dot sign is a multiplication sign!
Now you have your t-value, which is around 2.5. To check what the probability of getting this t-value by chance is, we look it up on a t-table, which you can find here. The tables look pretty awful, but we can figure it out. "df" stands for degrees of freedom, which in our case is the number of subjects minus 2 (don't ask why), so in our case we look at row 18. At the top you can see a row called "P-value", and this is what we are interested in. A P-value is the chance of getting this result by chance alone. We can see that our t-value lies in-between the P-values of 0.05 and 0.02. In other words, the chances that our results were just a fluke is between 2\% and 5\%.
So, what do we think about that? Is between 2 to 5\% low enough? Whilst we could debate endlessly about how low a probability of a fluke needs to be to take something as scientific evidence, in medicine the answer is set in stone: anything below 5\% is taken as evidence that something works, and anything above 5\% is not. P-values are usually abbreviated to "P", and probabilities are usually written in decimal form, so normally the results of successful scientific studies are described by saying "P < 0.05", as is the case in our experiment.
Although most doctors would be happy that this trial demonstrates that metformin is a good medicine for diabetes, some people would want to see a number better than P < 0.05, like P < 0.01 (1\% chance of a fluke). To make them happy, let's try repeating the trial with 20 people, where the mean and standard deviation of the population are the same.
Redo the t-value calculation by changing n to 20. What is the P-value now? Generally, the larger the number of people participating in a trial, the smaller the P-values are. That's why many real medical trials involve tens of thousands of people, so that the result will be very hard to dismiss as a fluke.
Letting The Computer Do The Calculations For You
Let's face it, calculating statistics this way is just not fun. An easier way to do it (and the way that scientists do it in real life) is to use computer software to do the calculations for you. While most statisticians use a software package called R, for now we'll try using Google Sheets instead.
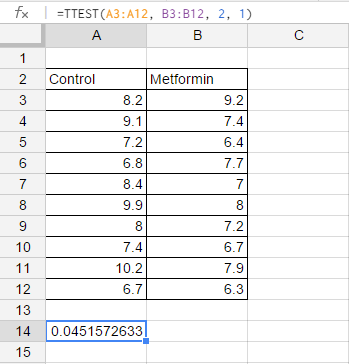
This screenshot says it all: just make a table of the control and metformin group, find an empty cell, and write "=TTEST(A3:A12, B3:B12, 2, 1)" into that cell. The number that appears is the P-value, ready to go! That was a lot easier than doing calculations by hand and using the t-tables.
The way this command is structured is that A3:A12 (which means A3 to A12) is the data set of the first group, and B3:B12 (which means B3 to B12) is the data set of the second group. As for the rest (the "2, 1")...you just don't want to know.
A Randomised Controlled Trial Of Your Own
Randomised experiments aren't just used in medicine. You can try a simple one yourself - does a nap improve maths performance?
Divide your class into two equal groups, making sure that the way you divide people is random. Those in the "control group" get to keep doing their usual work for ten minutes (hooray!). The "treatment" group get to close their eyes and sleep instead. At the end of the ten minutes, get everyone to login to this website and have a go at the Addition, Level 4 game.
At the end of the test, write the scores of those in the control and the treatment group on a board where everyone can see it. Now, run a t-test using a spreadsheet (or hand calculations if you prefer) to see what the P-value is for the difference in the performance of the two groups. If the P-value is less than 0.05, you have made a scientific discovery!
Of course, there is no need to limit yourself to this particular example. Come up with your own experiments, and see if you can make any more discoveries. The best idea is to pick something which is easily quantifiable (i.e. you can use a number to measure it). Test scores are a good example of this, because they are already a number. Here are some ideas:
1. Does studying more give you better marks?
2. Do students perform better in afternoon tests compared with morning ones?
3. Does exercise improve test scores?
4. Does turning off your facebook account one month before exams give you better marks? (good luck convincing people to take part in this experiment!)