
Venn Diagrams and Two Way Tables
Venn Diagrams
A Venn Diagram is a pictorial way to display relationships between two different sets (or groups) of things. The idea of a Venn diagram was first introduced by John Venn in the late 1800's and they are still one of the most powerful visualisations for relationships.
Here is a simple example
Let's think about the numbers between 2 and 20.
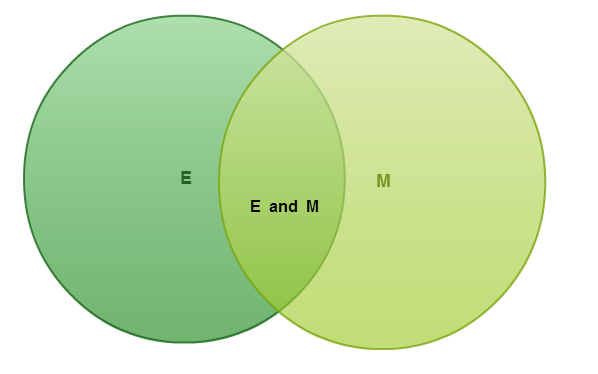
I'm going to create 2 groups, one for even numbers, and one for multiplies of 3.

We could call the sets after the events that are created.
Event E could be the "number is even".
Event M could be the "number is a multiple of 3".
So I can change the diagram to reflect this naming structure.
The next thing I do is write in all the numbers in the appropriate places. As I place a number I ask myself.... Is the number even? Is it a multiple of 3? Is it both? or Is it none of those options?

Take note of how the numbers that do not fit into either set are placed outside the circles.
Now that we have a Venn diagram, we can answer a whole range of questions.
List the items in events E, M and E&M
E = {2,4,6,8,10, 12,14,16, 18,20}
M = {3,6,9,12,15,18}
E and M = {6,12,18}
Probability that the number is Even
P(E) =$\frac{\text{total favourable outcomes }}{\text{total possible outcomes }}=\frac{10}{19}$total favourable outcomes total possible outcomes =1019
Probability that the number is a multiple of 3
P(M) = $\frac{\text{total favourable outcomes }}{\text{total possible outcomes }}=\frac{6}{19}$total favourable outcomes total possible outcomes =619
Probability that the number is both Even and a Multiple of 3
P(E and M) = $\frac{\text{total favourable outcomes }}{\text{total possible outcomes }}=\frac{3}{19}$total favourable outcomes total possible outcomes =319
Probability that the number is not even or a multiple of 3
P(not E or M) = $\frac{\text{total favourable outcomes }}{\text{total possible outcomes }}=\frac{6}{19}$total favourable outcomes total possible outcomes =619
Using a Venn Diagram can be a really powerful way to display information, and then interpret it in meaningful ways.
Two Way Tables
Like Venn Diagrams, two way tables are a visual way of representing information.
A simple two way table using the same example from above would look like this.

It's called a two way table because we can read information from it in two directions. We can read information from this two way table about how many numbers are even or not. Or from the other direction we can read information from it about how many numbers are multiples of 3 or not. Take note of how the totals add both across and down.
Example
John asked his classmates at school and found out that 56 students own a mobile phone and 40 of those students own an MP3 player as well. There are 8 students that do not own a mobile phone, but own an MP3 player. 6 students do not own either device. Construct a two way table summarizing the data.
Step 1 - Create the Table With Appropriate Headings

STEP 2 - add in the values you can read off straight from the question

STEP 3 - problem solve using addition and subtraction to complete the table


Worked Examples
QUESTION 1
The following table has been drawn up to show the results of a survey on smoking.
| Smokers | Nonsmokers | |
|---|---|---|
| Men | $46$46 | $96$96 |
| Women | $52$52 | $100$100 |
How many men were surveyed?
How many of the people surveyed were smokers?
What percentage of women were nonsmokers? Write your answer correct to 2 decimal places.
What percentage of nonsmokers were women? Write your answer correct to 2 decimal places.
If a person is selected at random from the group, what is the probability that he is a male smoker? Write your answer as a percentage correct to 2 decimal places.
QUESTION 2
In a particular high school where there are $91$91 year 12 students, $40$40 students study 4 Unit English only and $36$36 students study 4 Unit Mathematics only. The Venn diagram depicts this situation. If a student is randomly chosen, what is the probability that this student is studying:

4 Unit English and 4 Unit Mathematics.
4 Unit English only.
4 Unit Mathematics only.
4 Unit Mathematics or 4 Unit English.
neither subject