topic badge

9.02 Fair decisions using probability

Introduction

In the previous lesson, we learned that a sample must be representative of a population before we make inferences about the population. One way to make a sample representative is by using randomization. In the Geometry lessons  12.03 Conditional Probability  and  12.02 Probability,  we learned how to caclulate theoretical probabilities. In this lesson, we will use simulation to create random samples, then compare the experimental probability from the simulation to the theoretical probability.

Fair decisions using probability

Probability is the study of chance, and we use it to make predictions and fair decisions. Recall that we calculate the probability of an event by finding P\left(\text{Event}\right)=\dfrac{\text{Number of outcomes satisfying the event}}{\text{Total number of possible outcomes}}

The probabilities of all the possible events in the sample space will sum to 1.

We can make predictions by first creating the sample space, then determining the theoretical probability of each outcome. We can also make predictions by running experiments or looking at data that has already been collected. This is called experimental probability.

The experimental probability will be closer to the theoretical probability when more trials are run in an experiment. If the experiment contained a lot of trials and the probabilities do not resemble the theoretical probabilities, there may be reason to question the hypothesis of the experiment.

Because experiments take a lot of time, we can use tools to simulate an experiment. These tools may include cards, a die, a spinner, a random number generator, a coin, etc. When using these tools, we need to assign outcomes that match the theoretical probability.

Exploration

A science teacher gives a multiple-choice quiz to his students. There are 10 questions with 4 multiple-choice options each. A student would need a score of 60\% or above to pass.

After taking their test and receiving their scores, one of the students in the class said, "I didn't even study for this test and I passed. Science is so easy."

The simulation below shows the number of questions guessed correctly if a person was guessing at random. There are 100 trials represented.

  1. Use the simulator to determine the score a student is most likely to receive if they guess at random.

  2. Explain whether or not you believe that the student guessed randomly.

  3. What is a possible explanation for the student's passing score?

Loading interactive...

Examples

Example 1

Julio, Felipe, and Maria had daily chores. Their least favorite chore was cleaning the bathroom. The oldest brother, Julio, convinced his siblings that they should draw names from a hat to decide who cleans the bathroom each day instead of taking turns.

He wrote all 3 of their names on separate pieces of paper and placed them in the hat.

a

Felipe got upset because he had to clean the bathroom 4 times in one week, but Julio only had to clean it once. He thinks Julio is not drawing names fairly. Explain why Felipe thinks that with a fair draw, he would only have to clean the bathroom at most 3 times in a week.

Worked Solution
Create a strategy

Felipe is thinking about the probability theoretically.

Apply the idea

Theoretically, two of them would clean the bathroom twice a week, and one person would clean it three times in a week. In other words, there is a \dfrac{1}{3} chance of him having to clean the bathroom. 7\text{ days}\cdot \dfrac{1}{3}\approx 2.33\text{ days} This shows Felipe should expect to only clean the bathroom 2 to 3 times a week.

b

The table below shows the results of 200 simulations, each simulating 7 draws with each person having a probability of \dfrac{1}{3} of getting picked.

\text{Number of times}\\ \text{a person is picked}01234567
\text{Frequency}1248584927330

Determine if Felipe is correct. Is it reasonable to believe the draw was unfair?

Worked Solution
Apply the idea

The experiment simulates the outcome of random name draws for 200 weeks. The results show that Felipe would clean the bathroom 4 times a week 13.5\% of the time. This percentage means that in a fair draw, it is possible to have some weeks where you clean more than others. This one-time outcome was less likely than other outcomes, but not unlikely. We do not have enough evidence to believe the draw was unfair.

Reflect and check

One way to simulate this on your own is by using a standard number cube. The numbers 1–2 can represent Felipe getting picked, and the numbers 3–6 can represent a different sibling getting picked. Roll the dice 7 times and record how many times a 1 or 2 was rolled. Repeat the process 199 more times.

Example 2

Ravi is researching the number of people who are left-handed. He discovered the results of an observational study which found 358 people were left-handed and 2\,642 were right-handed.

a

According to this study, determine the probability a person is left-handed.

Worked Solution
Create a strategy

The probability can be found by \frac{\text{Number of left-handed people}}{\text{Total number of people}}

Apply the idea
\displaystyle \dfrac{358}{358+2642}\displaystyle =\displaystyle \frac{358}{3000}
\displaystyle \approx\displaystyle 0.11933
\displaystyle =\displaystyle 11.933\%

The sample shows that approximately 12\% of people are left-handed.

b

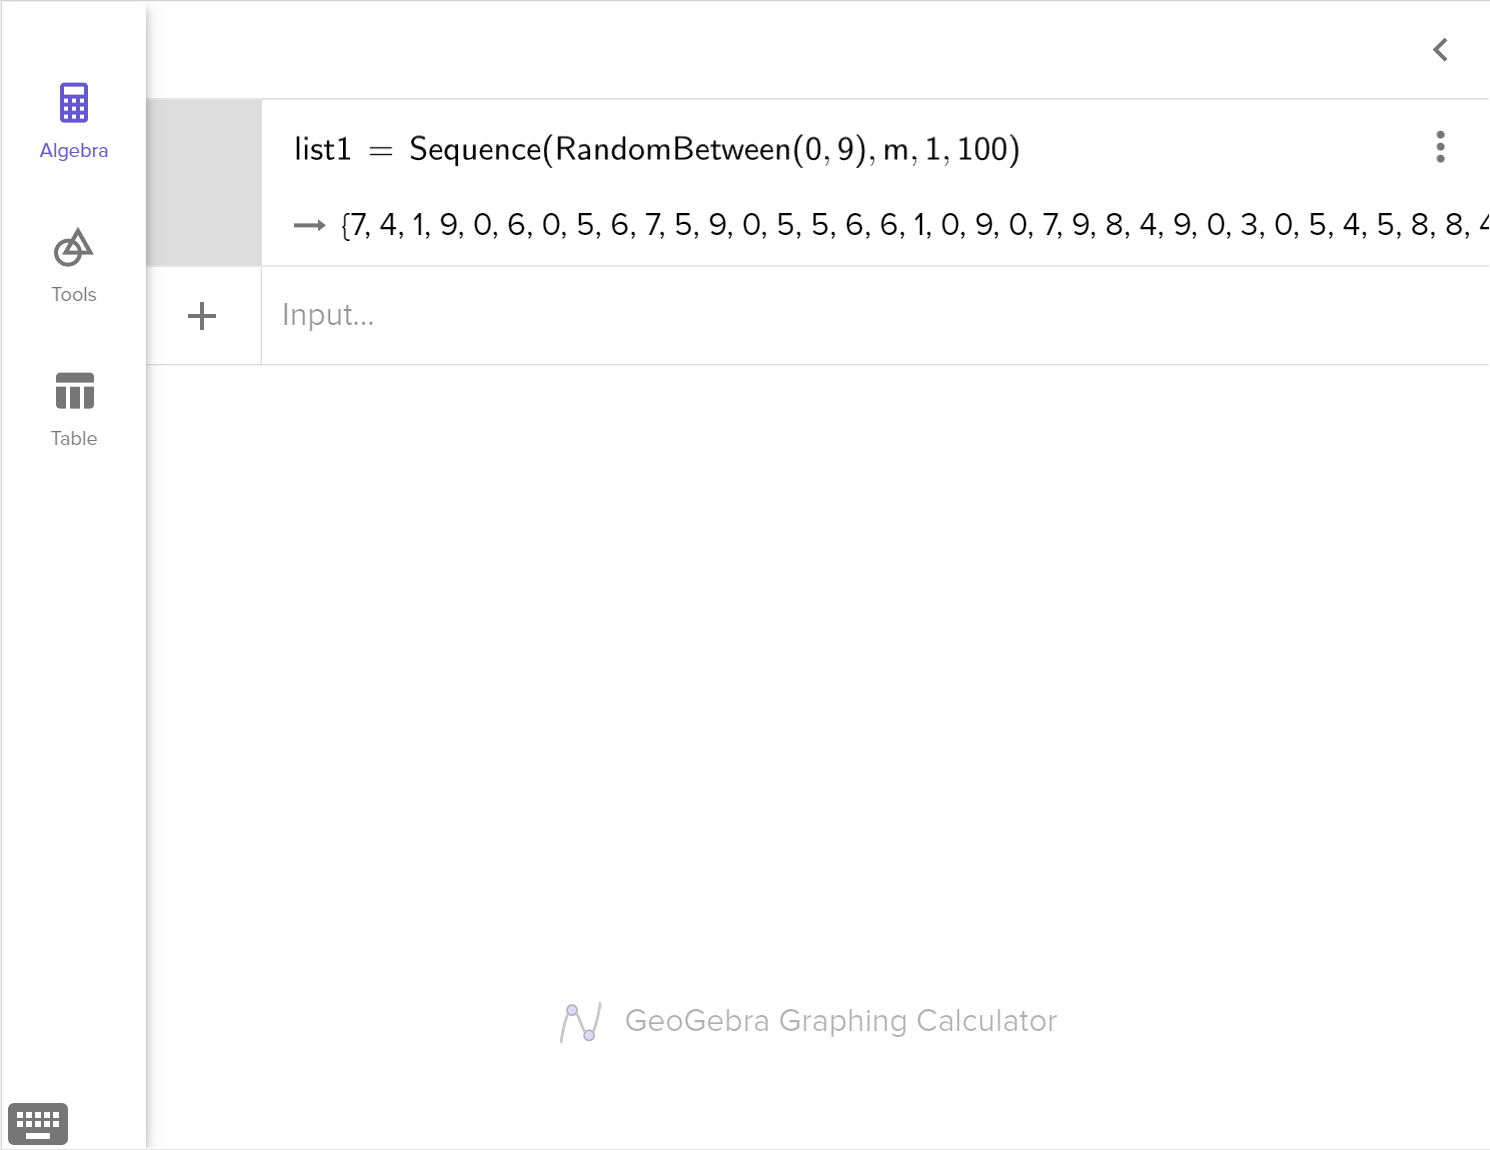
As Ravi continued researching, he found another resource that said 10\% of people in the world are assumed to be left-handed. Design and run a simulation to model this outcome. Compare the results to the results from the sample in part (a).

Worked Solution
Create a strategy

When designing a simulation, we need to make sure the probability of each outcome is equal to the theoretical probability. In this case, we need to assign an outcome to represent left-handed people and an outcome to represent right-handed people.

The outcome that represents left-handed people should have a 10\% chance of occurring, and the outcome that represents right-handed people should have a 90\% chance of occurring.

Apply the idea

We can use technology to generate random numbers from 0–9 for 100 simulations. We can record a left-handed person if the number generated is 0 and record a right-handed person if the number generated is 1–9.

To use GeoGebra to generate random numbers, we can create a list and let it equal a sequence of numbers. Begin typing the word Sequence, and select the option for Sequence(Expression,Variable,Start Value,End Value).

A screenshot of the GeoGebra graphing calculator showing the five options for the Sequence command. The option Sequence left parenthesis Expression, Variable, Start Value, End Value right parenthesis is selected. Speak to your teacher for more details.

For the expression, we want it to generate random integers between 0 and 9, so we type the word Random and select RandomBetween(Minimum Integer,Maximum Integer).

A screenshot of the GeoGebra graphing calculator showing the two options for the RandomBetween command. The option RandomBetween left parenthesis Minimum Integer, Maximum Integer right parenthesis is selected. Speak to your teacher for more details.

Next, type 0 as the minimum integer, 9 as the maximum integer, and type a letter for the variable. To generate 100 numbers, the start value is 1 and the end value is 100.

A screenshot of the GeoGebra graphing calculator showing how to generate 100 random numbers between 0 and 9 inclusive using the Sequence and RandomBetween commands. Speak to your teacher for more details.

Finally, we can count the number of zeros that were generated. In this simulation, there are 12 zeros. We can count by hand or enter the following command into the input bar to have the program count the number of zeros in the list for us CountIf(x==0, list1).

This means that 12\% of the sample is left-handed. This is the same statistic as found in the study from part (a).

c
A dot plot titled Percentage. The number of dots is as follows: at 2, 3; at 4, 7; at 6, 11; at 8, 17; at 10, 20; at 12, 16; at 14, 12; at 16, 8; at 18, 4; at 20, 2.

Since the samples from parts (a) and (b) both suggested that 12\% of people are left-handed, Ravi decided to run the simulation in part (b) 100 times to verify this result. The distribution shows 100 simulations each with a sample size of 100.

Determine if it is plausible that 10\% of the population is actually left-handed, when an experimental result observed that 12\% of people in a random sample were left-handed.

Worked Solution
Create a strategy

This simulation assumed that 10\% of the population is left-handed. We need to determine how likely it is for a sample to get a result of 12\% if the population is actually 10\%.

Apply the idea

According to the simulation, a sample statistic of 12\% is likely to occur when the population parameter is 10\%. Therefore, it is plausible to assume that 10\% of the population is left-handed.

Reflect and check

Statistics help us make inferences about the population, but they will not be 100\% accurate. The only way to know the true percentage of left-handed people is to collect data on every single person in the world.

Since this is not possible, we can use statistics like the ones above to get a general idea of the interval in which the true percentage lies. In statistics, this is referred to as a confidence interval. We will discuss this concept more in an upcoming lesson.

Idea summary

Theoretical and experimental probability can be used to make fair decisions or predictions. The experimental probability will be closer to the theoretical probability when conducting larger numbers of trials.

If the experiment contained many trials and the probabilities do not resemble the theoretical probabilities, there may be reason to question the hypothesis of the experiment.

Simulation tools can be used to simulate an experiment or multiple experiments. When using these tools, we need to assign outcomes that match the theoretical probability.

Outcomes

S.IC.A.2

Decide if a specified model is consistent with results from a given data-generating process, e.g. Using simulation.

S.MD.B.6 (+)

Use probabilities to make fair decisions.

S.MD.B.7 (+)

Analyze decisions and strategies using probability concepts.

What is Mathspace

About Mathspace