
Recognising the shape of data
Symmetry
Data may be described as symmetrical or asymmetrical.
The normal distribution is the most common example of symmetrical data. The normal distribution looks like this:

The '0' point right in the middle of the distribution represents the mean, the median and the mode- all these measures of central tendency are equal. If we use that '0' line as our axis of symmetry, do you notice how the left hand side is a perfect reflection of the right hand side? That means it's symmetrical.
If your data is asymmetrical (ie. it isn't symmetrical), it may be described as skewed.
Skew
Positive skew
A positive skew means that the majority of the scores are low and the long tail is on the positive side of the peak of the graph. It is also sometimes called a right skew. This means the mean is greater than the median, which is greater than the mode.
MODE < MEDIAN < MEAN
A positively skewed graph looks something like this.
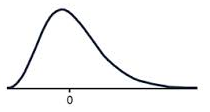
Notice how most of the scores are in the lower half of the graph?
Negative Skew
A negative skew means that the majority of the scores are high and the long tail is on the negative side of the peak. It is also sometimes called a left skew. This means the mode is greater than the median, which is greater than the mean.
MEAN < MEDIAN < MODE
A negatively skewed graph looks something like this.
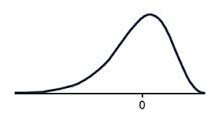
Notice how most of the scores are in the higher half of the graph?
Worked Examples
Question 1
How many peaks are there on the graph?

$\editable{}$ peaks
QUESTION 2
The table shows the number of crime novels in a bookshop for different price ranges.
| Price of crime novel to nearest $\$5$$5 | Frequency |
|---|---|
| $5$5 | $5$5 |
| $10$10 | $10$10 |
| $15$15 | $17$17 |
| $20$20 | $8$8 |
| $25$25 | $17$17 |
| $30$30 | $10$10 |
| $35$35 | $5$5 |
Plot this data as a histogram.
Which of the following best describes the data in the graph and table?
Symmetrical
ARight skewed
BLeft skewed
CUniform distribution
D
QUESTION 3
What type of skew is shown in the graph below?
No skew
ARight skew
BLeft skew
C