
In this chapter, we are going to start by looking at calculating probabilities for normally distributed data using CAS calculators.
When we talk about probabilities for normally distributed data we are referring to the proportion of data values that we would expect to observe within a specific range of values.
Recall that the two parameters needed to describe a normal distribution are the mean and the standard deviation or rather the variance.
A normal distribution with mean $\mu$μ and standard deviation $\sigma$σ can be described with the notation $N(\mu,\sigma^2)$N(μ,σ2).
Note that this notation uses the variance $\sigma^2$σ2 to describe the spread of the data.
Exploration
Suppose that many tyres produced by a machine are measured. All the tyres should be identical, but it is found that there is some variation in the measurements of the diameter and a frequency histogram of the measurements shows the characteristic normal curve shape.
From the data it is found that the mean diameter is $508$508 mm and the standard deviation is $1.5$1.5 mm. We can then say that the data has a $N(508,1.5^2)$N(508,1.52) distribution.
For our measured tyres, we want to know the probability that the diameter lies within the acceptable limits of $504$504 mm to $510$510 mm.
It is useful to visualise a graph before turning to our CAS. The area under the normal distribution curve represents the whole population, so the shaded proportion represents the probability that a tyre will have an acceptable diameter.

Casio ClassPad
From the Main application, use the menus to access the Normal Cumulative Distribution function:
Interactive -> Distribution -> Continuous -> normCDf

TI-Nspire
Tap the Menu button then navigate to the Normal Cumulative Distribution function:
5. Probability -> 5. Distributions -> 2. Normal CDf...

From the CAS result we can see that approximately $90.5%$90.5% of tyres are within specified limits.
Practice questions
QUESTION 1
A random variable, $X$X, is normally distributed with a mean of $5$5 and a standard deviation of $4$4. Determine, to four decimal places:
$P\left(X<16\right)$P(X<16)
$P\left(X>16\right)$P(X>16)
$P\left(0
QUESTION 2
Using your calculator, find the area under the normal curve between $z=-1.23$z=−1.23 and $z=-1.55$z=−1.55.
Give your answer to four decimal places.
QUESTION 3
The operating times of phone batteries are approximately normally distributed with mean $34$34 hours and a standard deviation of $4$4 hours. Answer the following questions using your calculator:
Approximately what percentage of batteries last between $33$33 and $38$38 hours?
Round your answer to the nearest percent.
Approximately what percentage of batteries last between $28$28 hours and $41$41 hours?
Any battery that lasts less than $23$23 hours is deemed faulty. If a company manufactured $51000$51000 batteries, approximately how many batteries would they be able to sell? Round your answer to the nearest integer.
Percentiles
The $n$nth percentile is the value $z$z such that $n%$n% of observations are below $z$z.
In other words, if there are $n%$n% of observations below $z$z, then $z$z is the $n$nth percentile.
A percentile is the value below which the specified percentage of the population lies.
Consider the height of female adults. If the $45$45th percentile height is $155$155 cm, this means that $45%$45% of female adults are shorter than $155$155 cm.
Similarly, if we are at the $94$94th percentile for a mathematics competition result, then our score is greater than $94%$94% of the candidates. In other words, we are in the top $6%$6% of candidates.
Note that the percentile is not the same as our actual score in the test. Rather it is a reflection of our rank in the ordered set of scores from all the participants.
Quantiles
Quantiles are equivalent to percentiles, but expressed as a decimal instead.
A quantile is the value below which the specified proportion of the population lies.
So for the situation above, where we are at the $45$45th percentile for our height, we would say that we are at the $0.45$0.45 quantile.
Similarly, if we are at the $94$94th percentile in a mathematics competition, then we are at the $0.94$0.94 quantile. In other words, there is a probability of $0.94$0.94 that a randomly selected candidate will have scored less than you.
Practice questions
QUESTION 4
Mensa is an organisation that only accepts members who score in the $0.98$0.98 quantile or above in an IQ test. What does this mean? Select all that apply.
To be accepted into Mensa, a person must score higher than $98%$98% of other people on the IQ test.
ATo be accepted into Mensa, a person must score higher than $98%$98% on the IQ test.
BA successful applicant’s IQ score will be among the bottom $98%$98% of the population.
CA successful applicant’s IQ score will be among the top $2%$2% of the population.
D
Quantiles and percentiles with CAS
We usually need to use the capabilities of our CAS calculators to determine quantiles and percentiles, as shown in the following examples.
Practice questions
example 1
The heights of 16 year old females are known to be normally distributed with a mean of $165$165 cm and a standard deviation of $2$2 cm.
(a) Calculate the height that $98%$98% of 16 year old females fall below.
Think: Again, it's useful to at least visualise a graph before turning to our CAS. The shaded region represents the proportion of 16 year old females with height less than the $98$98th percentile.

Do: Use your CAS to find the height that $98%$98% of 16 year old females fall below.
Casio ClassPad

So we can see that the height is $168$168 cm, rounded to the nearest cm.
TI-Nspire
In the Calculator section of the TI-Nspire CAS Calculator, select Menu -> 5. Probability -> 5. Distributions -> 3. Inverse Normal.
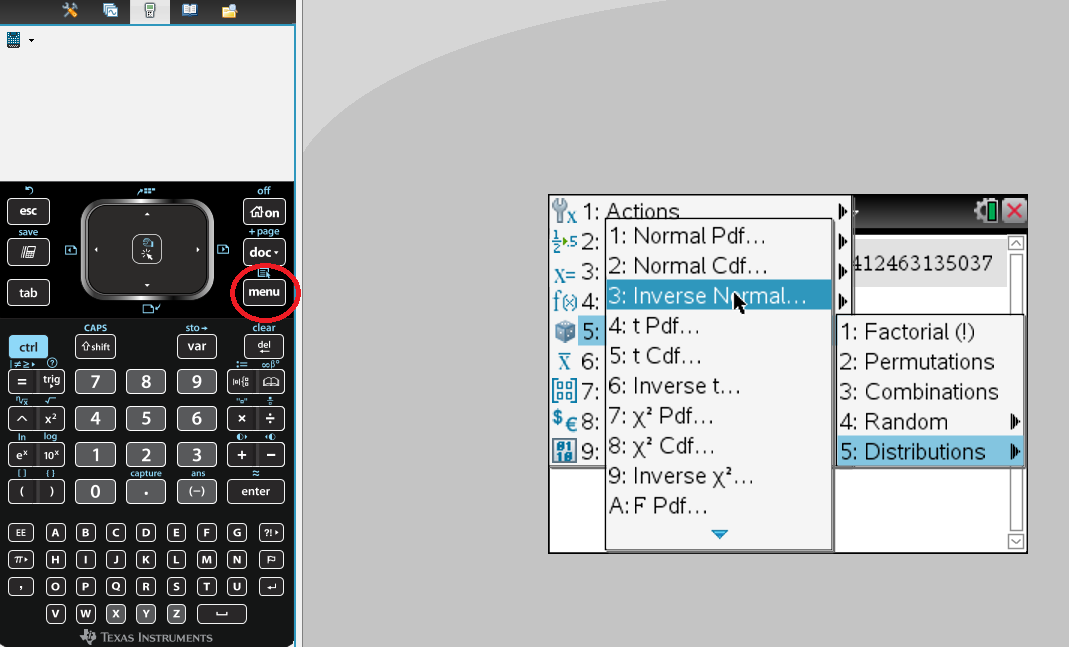
The Inverse Normal function calculates the score of a normal distribution given the area under the graph to the left of that score (e.g. the probability, between $0$0 and $1$1). It also requires the curve's mean $\mu$μ and standard deviation $\sigma$σ.
So to calculate the height of the $98$98th percentile, we are inputting an area of $0.98$0.98, as well as the given mean $168$168 and standard deviation $2$2.

Press OK and we will get an answer of $168$168 cm, rounded to the nearest whole number. Alternatively, we could input the command $\text{InvNorm(0.98, 168, 2)}$InvNorm(0.98, 168, 2) directly into the calculator and get the same answer immediately.
(b) What is the height of the $0.4$0.4 quantile?
Think: We will follow the same process of drawing a sketch and then using CAS to calculate. The shaded region represents the proportion of 16 year old females with height less than the $0.4$0.4 quantile.
Do:

Casio ClassPad

So $40%$40% of 16 year old girls are shorter than $163.5$163.5 cm.
TI-Nspire
Remember that the $0.4$0.4 quantile is equal to the $40$40th percentile. So to calculate, we would use the same approach as before when calculating the percentile, except for area we would input the quantile value directly. In this case, we would input $0.4$0.4

Alternatively, we could input the command $\text{InvNorm(0.4, 168, 2)}$InvNorm(0.4, 168, 2) directly into the calculator and get an immediate answer of $163.5$163.5 cm, rounded to $1$1 decimal place, as the height of the girls at the $0.4$0.4 quantile.
Practice questions
QUESTION 5
For a normal variable defined by $X$X$~$~$N\left(100,100\right)$N(100,100), use a CAS to determine the following values.
Round your answers to three decimal places.
The $0.2$0.2 quantile
The $90$90th percentile
The lowest score that is greater than the bottom $30$30 percent
QUESTION 6
Using your calculator, find the value of $k$k so that the probability of a $z$z-score being at most $k$k is equal to $0.218$0.218 in the standard normal distribution.
Give your answer correct to $4$4 decimal places.
Percentiles, quantiles and the 68-95-99.7% rule
Sometimes we can determine quantiles and percentiles without a calculator, if the values that we are calculating happen to correspond to values that we know for the $68-95-99.7%$68−95−99.7% empirical rule.
Practice question
example 2
The results of an IQ test are known to be normally distributed with a mean of $100$100 and a standard deviation of $10$10.
(a) What is the $84$84th percentile?
Think: We need to consider how many standard deviations above or below the mean that corresponds to $84%$84% of the lower tail of the normal distribution. Thinking about $84%$84%, we know this is made up of $50%$50% (half the curve) and $34%$34%. From our experience with the $68-95-99.7%$68−95−99.7% rule, we know that $34%$34% tells us that we are one standard deviation above the mean. We can sketch this on a graph.
Do:

From our graph, we can see that the $84$84th percentile is $110$110 on this IQ test.
(b) What is the lowest mark achieved by someone scoring in the $0.975$0.975 quantile?
Think: The lowest mark achieved by someone scoring in the $0.975$0.975 quantile is the same as the mark that is at the $0.975$0.975 quantile. Using similar reasoning as we did in part (a), we know that $0.975$0.975 is made up of $0.5$0.5 (half the curve) and $0.475$0.475 which is half of $0.95$0.95. Thus we are looking at the score that is two standard deviations above the mean. Again, the graph is useful here.

From our graph, we can see that the lowest mark achieved by the $0.975$0.975 quantile is $120$120 on the IQ test.
Practice questions
QUESTION 6
The heights of a certain species of fully grown plants are thought to be normally distributed with a mean of $40$40 cm and a standard deviation of $1$1 cm.
Use the $68-95-99.7$68−95−99.7 rule to answer the following questions.

What is the height of the shortest plant in the $84$84th percentile?
What is the height of the shortest plant in the $0.0015$0.0015 quantile?