topic badge

6.05 Transformations of sine and cosine functions

Introduction

We made connections between the unit circle and the graphs of sine and cosine in lesson  6.04 Graphing sine and cosine functions  . In this lesson, we explore how the amplitude, frequency, and midline of the sine and cosine graphs are changed when the function is transformed.

Transformations of sine and cosine functions

Exploration

Explore the applet by dragging the sliders

Loading interactive...
  1. How does changing each slider affect the graph of sine or cosine?

  2. Is it possible to move the graph of cosine exactly on top of the graph of sine?

The graphs of sine and cosine experience transformations that change the key features of the functions and can be considered sinusoidal functions.

Sinusoidal function

Any function of the form y=a \sin \left[b\left(x-c \right)\right] + d that has the pattern of a sine wave

Since the graph of cosine can be transformed to be identical to the graph of sine, we also consider it to be sinusoidal.

The general form of a sinusoidal function changes the amplitude, frequency, and midline of the sine and cosine graphs.

\displaystyle f \left( x \right)= a \sin \left[b\left(x-c \right)\right] + d
\bm{a}
amplitude change where \left|a\right| >1 is a vertical stretch, \left|a\right| < 1 is a vertical compression, {a < 0} is a reflection across the x-axis
\bm{b}
period is \dfrac{2\pi}{\left|b\right|}, where \left|b\right| >1 is a horizontal compression, \left|b\right| < 1 is a horizontal stretch, {b < 0} is a reflection across the y-axis
\bm{c}
horizontal translation by c units
\bm{d}
vertical translation by d units

Examples

Example 1

Sketch a graph and state the amplitude for each of the following functions.

a

f \left( x \right) = 5 \sin x

Worked Solution
Create a strategy

Graph f \left( x \right)= 5 \sin x with y=\sin x on the same coordinate grid using a table of values, then use the graph to determine its amplitude.

Apply the idea
x0\dfrac{\pi}{2}\pi\dfrac{3 \pi}{2}2 \pi
y=\sin x010-10
f\left( x \right) = 5 \sin x050-50
\frac{1}{2}\pi
1\pi
\frac{3}{2}\pi
2\pi
x
-5
-4
-3
-2
-1
1
2
3
4
5
y

Since the amplitude is half the distance between the maximum and minimum values of a periodic function, we can see that the amplitude of {f \left( x \right) = 5 \sin x} is 5.

Reflect and check

We know that the amplitude of the parent function y= \sin x is 1, and the amplitude of {f \left( x \right) = 5 \sin x} is 5. We can see that the value of a in the general sinusoidal form of the function leads to horizontal stretches and compressions, and that the amplitude of the transformed function will be |a|.

b

The graph of y= \cos x is reflected across the x-axis, then compressed in the vertical direction so that its minimum value is -\dfrac{3}{4}.

Worked Solution
Create a strategy

Graph the function y=\cos x, then reflect the function across the x-axis, and compress it so that its minimum value is -\dfrac{3}{4}, leading its maximum value to become \dfrac{3}{4}.

Apply the idea

Start with the graph of y=\cos x:

\frac{1}{2}\pi
1\pi
\frac{3}{2}\pi
2\pi
x
-1
1
y

Then, reflect y=\cos x across the x-axis:

\frac{1}{2}\pi
1\pi
\frac{3}{2}\pi
2\pi
x
-1
1
y

Finally, compress the reflected graph such that its minimum values become -\dfrac{3}{4} and its maximum values become \dfrac{3}{4}:

\frac{1}{2}\pi
1\pi
\frac{3}{2}\pi
2\pi
x
-1
1
y

The amplitude of the function is \dfrac{3}{4}.

Reflect and check

After applying the transformations to the parent function, we can use them to help us build the equation of the function.

We know that the vertical compression changes the value of a, and reflecting across the x-axis also makes that value negative. The equation of the transformed function would be f \left(x \right) = -\dfrac{3}{4} \cos x.

Example 2

Consider the function g \left( x \right) shown on the coordinate plane:

\frac{1}{2}\pi
1\pi
\frac{3}{2}\pi
2\pi
x
-1
1
g \left( x \right)
a

Compare the period, midline, amplitude, and domain and range of g \left( x \right) to the key features of the parent function f \left(x \right) = \sin x.

Worked Solution
Create a strategy

Graphing the parent function on the same coordinate plane as g \left( x \right) will help us identify changes in the key features.

Apply the idea
\frac{1}{2}\pi
1\pi
\frac{3}{2}\pi
2\pi
x
-1
1
y

The midline, amplitude, and domain and range have not changed from the parent function to the transformed function. However, the period has changed from 2 \pi to \pi.

b

Write the equation of g \left( x \right).

Worked Solution
Create a strategy

We know that the period of the parent function f \left( x \right) = \sin x is 2 \pi, but the graph of g \left( x \right) is \pi.

If the amplitude, midline, or range of the function were to change, we would also see a change in the values of a and d in the transformed equation.

Apply the idea

The graph of g \left(x \right) experiences a change in its period, from 2 \pi to \pi, meaning that the function f \left( x \right) = a \sin \left[b\left( x - c \right)\right] + d must have a change in its b-value, which changes the period to \dfrac{2\pi}{|b|}, so b=2 or b=-2.

We can note that y=\sin \left( -2x \right) would represent a reflection across the y-axis, and we can see by the graph that no reflection occurred. So, b=2 and the equation of the function is g \left(x \right)= \sin2x.

Example 3

Consider the function f \left(x \right) = \sin x and g \left( x \right) = \sin \left( x - \dfrac{\pi}{2} \right).

a

Complete the table of values for both functions:

x0\dfrac{\pi}{2}\pi\dfrac{3 \pi}{2}2 \pi
f\left( x \right)
g\left( x \right)
Worked Solution
Create a strategy

Substitute each value of x into both f \left(x \right) and g \left( x \right) and evaluate.

Apply the idea
x0\dfrac{\pi}{2}\pi\dfrac{3 \pi}{2}2 \pi
f\left( x \right)010-10
g\left( x \right)-1010-1
b

Graph f \left(x \right) and g \left(x \right) on the same coordinate plane.

Worked Solution
Create a strategy

Use the table of values from part (a) to plot the functions on the same coordinate plane and connect the points with a curve.

Apply the idea
\frac{1}{2}\pi
1\pi
\frac{3}{2}\pi
2\pi
x
-1
1
y
c

Describe the transformation from f \left(x \right) to g \left(x \right).

Worked Solution
Create a strategy

Examine the key features of both graphs and identify any changes.

Apply the idea

The amplitude, period and midline remain the same, so the graph has not been stretched or compressed either vertically or horizontally. We can see that the x-intercepts and the minimum and maximum points have all shifted to the right by \dfrac{\pi}{2}, so the transformation is a phase shift to the right \dfrac{\pi}{2} units.

Reflect and check

Once we understand how transformations to the graph are related to the general form of the equation, we can recognize the transformation steps by looking at the equation alone.

When we compare g \left( x \right) = \sin \left( x - \dfrac{\pi}{2} \right) to the general equation f \left(x \right) = \sin x, we can see that only the value of c has altered. We know that the phase shift for this equation will be c = \dfrac{\pi}{2}.

Example 4

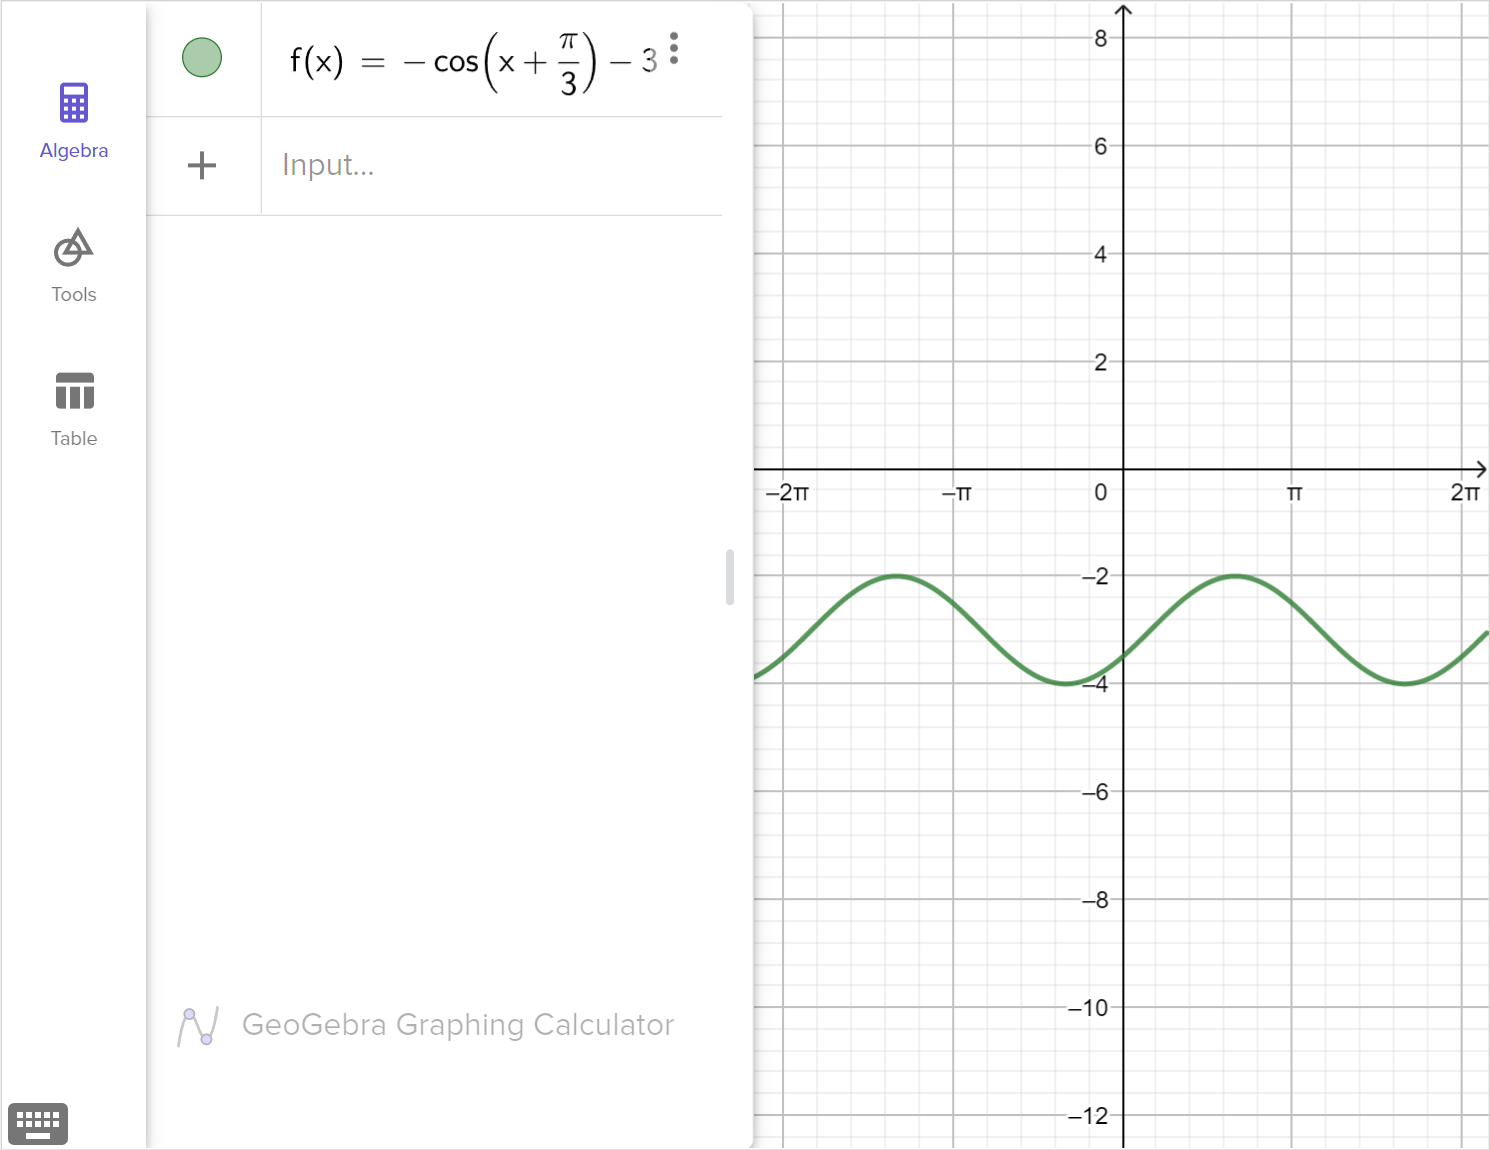
The graph of the function f\left(x\right)=\cos x is transformed as follows:

  • The graph is reflected across the x-axis

  • The graph is horizontally translated to the left by \dfrac{\pi}{3}

  • The graph is vertically translated downwards by 3 units

a

Graph the transformed function described.

Worked Solution
Create a strategy

Apply each transformation to the parent function y= \cos x.

Apply the idea

Start with the graph of y=\cos x:

1\pi
2\pi
x
-1
1
y

Reflect y=\cos x across the x-axis:

1\pi
2\pi
x
-4
-3
-2
-1
1
y

Translate the reflected graph left by \dfrac{\pi}{3} units and down by 3 units:

1\pi
2\pi
x
-4
-3
-2
-1
1
y
b

Determine the equation of the transformed function in the form g \left(x \right) = a\cos \left[b \left( x - c \right)\right] + d, where c is the least positive value in radians.

Worked Solution
Apply the idea

If the graph of a function is reflected across the x-axis, the resulting function is given by -f\left( x \right), so the value of a=-1.

A horizontal translation or phase shift is given by the value of c and a vertical translation by the value of d. No horizontal compression or change in the period of the function is listed, so we will not change the value of b.

The equation of the function is g \left( x \right) = - \cos \left(x + \dfrac{\pi}{3} \right) - 3.

Reflect and check

We can verify that the equation matches the graph of the transformed function using technology:

A screenshot of the GeoGebra graphing calculator showing the graph of f of x equals negative cosine left parenthesis x plus pi over 3 right parenthesis minus 3. Speak to your teacher for more details.
c

State the midline, amplitude, period, and domain and range of the function.

Worked Solution
Create a strategy

Use the graph of the transformed function from part (a) to identify key features:

1\pi
2\pi
x
-4
-3
-2
-1
1
y
Apply the idea
  • Midline: y=-3

  • Amplitude: 1

  • Period: 2 \pi

  • Domain: \left( -\infty, \infty \right)

  • Range: [-4,-2]

d

Explain how the graph and function would be different if we performed the translations before the reflection.

Worked Solution
Create a strategy

Apply the algebraic translations to the equation of the function first, then the reflection.

Apply the idea

The equation of the functions with the translations applied to it would be h \left( x \right) = \cos \left(x + \dfrac{\pi}{3} \right) - 3. Then, if we reflected that function across the x-axis, we would have h \left( x \right) = - \left(\cos \left(x + \dfrac{\pi}{3} \right) - 3\right) = -\cos \left(x + \dfrac{\pi}{3} \right) + 3

The graph of the function would be located in quadrants 1 and 2 as opposed to where the originally transformed function was located, in quadrants 3 and 4.

Idea summary

Refer to the general form of the sinusoidal function to write or determine transformations to f \left( x \right) = \sin x:

\displaystyle f \left( x\right)= a \sin \left[b\left( x - c \right)\right] + d
\bm{a}
amplitude change where |a| >1 is a vertical stretch, |a| < 1 is a vertical compression, a < 0 is a reflection across the x-axis
\bm{b}
period is \dfrac{2\pi}{\left|b\right|}, where \left|b\right| >1 is a horizontal compression, \left|b\right| < 1 is a horizontal stretch, {b < 0} is a reflection across the y-axis
\bm{c}
horizontal translation by c units
\bm{d}
vertical translation by d units

Outcomes

F.IF.C.7.E

Graph exponential and logarithmic functions, showing intercepts and end behavior, and trigonometric functions, showing period, midline, and amplitude.

F.BF.B.3

Identify the effect on the graph of replacing f(x) by f(x) + k, kf(x), f(kx), and f(x + k) for specific values of k (both positive and negative); find the value of k given the graphs. Experiment with cases and illustrate an explanation of the effects on the graph using technology. Include recognizing even and odd functions from their graphs and algebraic expressions for them.

What is Mathspace

About Mathspace