topic badge

6.08 Modeling periodic phenomena (M)

Introduction

The modeling cycle continues to be an important part of solving problems that involve the messiness of the world around us. This lesson will use models of periodic phenomena to make sense of mathematics and verify that those models work.

A modeling cycle. Starting with the phrase Identify the problem inside a circle. An arrow pointing to the right where the phrase Create a model is inside a rectangle. Next is an arrow pointing downward where the phrase Apply and analyze is inside a rectangle. Then, an arrow pointing to the right where the phrase Interpret results is inside a rectangle. Next is an arrow pointing upward where the phrase Verify the model is inside a triangle. Then, an arrow pointing to the right where the phrase Report findings is inside a circle. There is an arrow pointing to the left from the phrase Verify the model to Create a model.

Each time we model a real-world situation, we should:

  1. Identify the essential features of the problem

  2. Create a model using a diagram, graph, table, equation or expression, or statistical representation

  3. Analyze and use the model to find solutions

  4. Interpret the results in the context of the problem

  5. Verify that the model works as intended and improve the model as needed

  6. Report on our findings and the reasoning behind them

Interpreting, verifying and reporting with models

When solving a problem involving periodic phenomena, we should consider what type of model will best represent a situation and whether we can verify that the model works as intended, by applying it to a problem situation and interpreting our results. When we make conclusions based on results, we should be prepared to report our findings.

Reporting with a model includes:

  • Information that is relevant to the audience

  • Enough detail that the audience understands the reasoning behind any recommendations

Reporting a model does not include:

  • Technical algebraic work

  • Mathematical jargon that could confuse the audience

Examples

Example 1

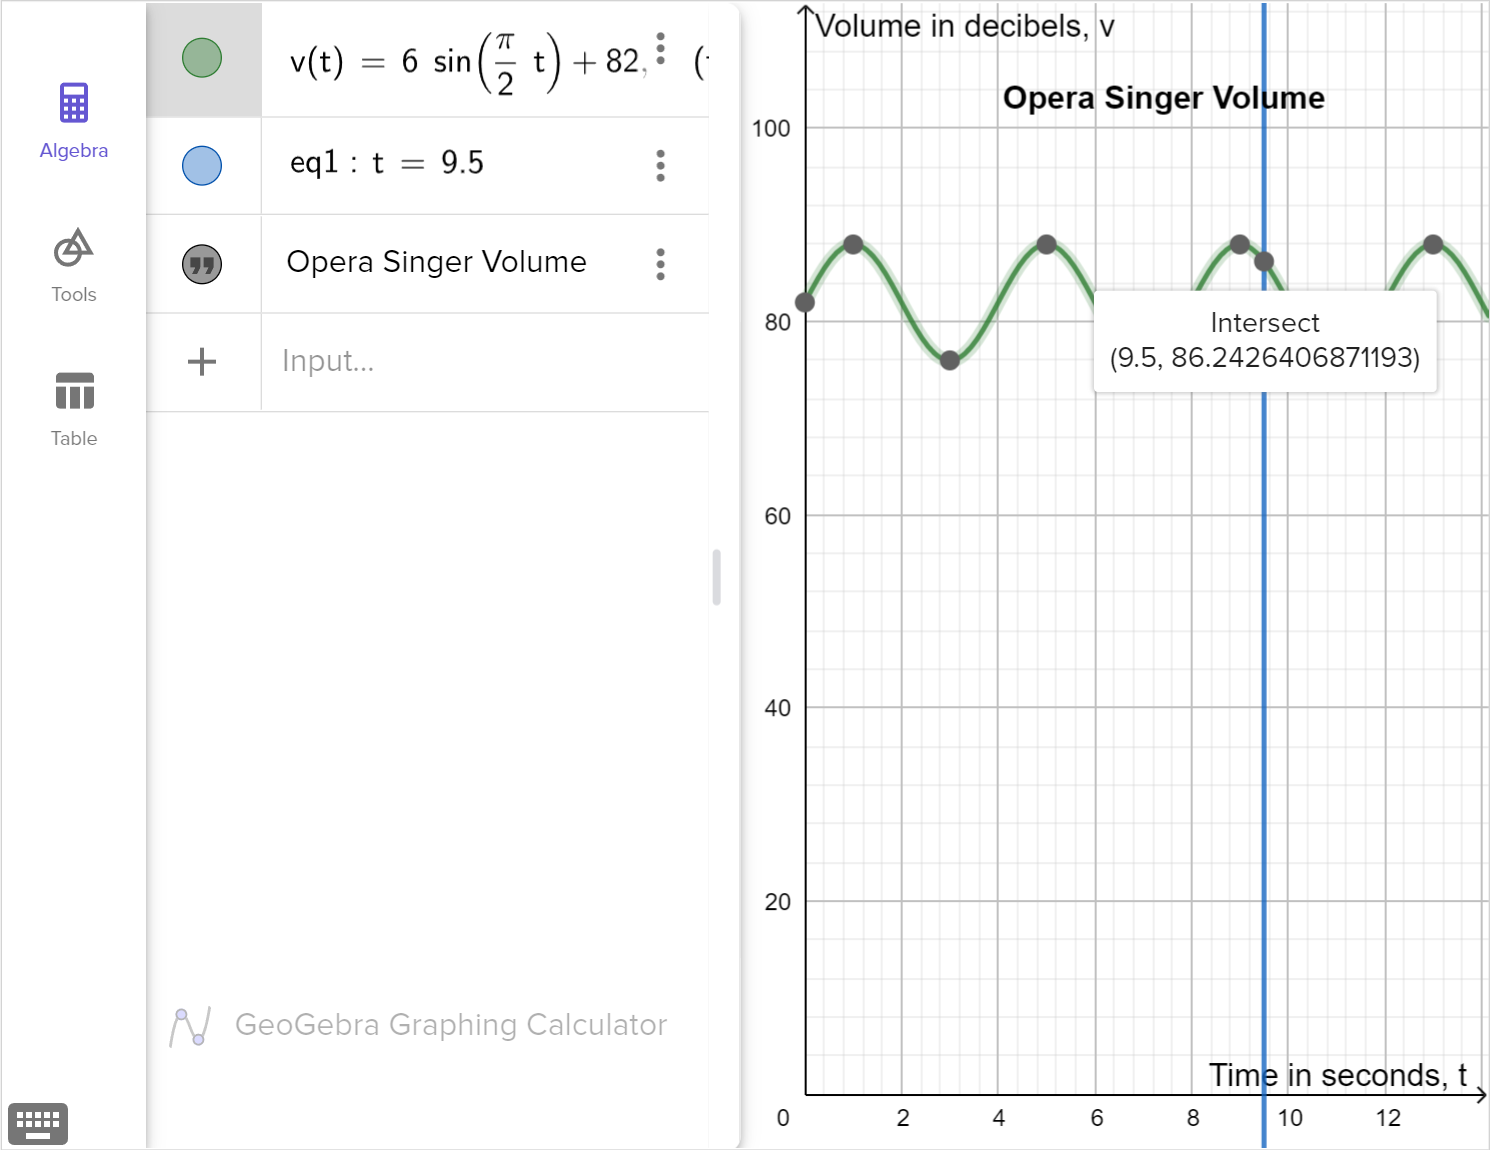
12 seconds into an opera song, there is a section in which the singer must hold a note but alternate between high and low volume for 12 seconds. During this part of the song, the volume in decibels, v, is modeled by the following graph:

Opera singer volume
1
2
3
4
5
\text{Seconds, }t
10
20
30
40
50
60
70
80
90
\text{Volume in decibels, }v

The volume after t seconds creates a sinusoidal pattern, with the following values recorded:

\text{Time in seconds, } t0123456
\text{Volume in decibels, } v82888276828882
a

Interpret the key features of the graph. What do they tell us about what's happening to the sound of the opera singer's voice?

Worked Solution
Create a strategy

We need to consider the contextual meaning of the information presented in the graph, such as how the variables are identified, the domain and range, and the intercepts. Since this is a periodic function, we should also consider the amplitude and period.

Apply the idea

Based on the graph, we can see that the domain is \left[0, 6 \right], so we are looking at the first six seconds of the 12-second section that the opera singer is alternating the volume of their voice.

The range of the function is \left[76, 88 \right], meaning that the opera singer's voice gets as low as 76 \text{ dB} and as high as 88 \text{ dB}, so we can see that the singer is alternating their voice a total of 12 \text{ dB}.

The y-intercept is at \left(0, 82 \right), meaning that at the start of the 12-second section, the singer's voice is at a volume of 82 \text{ dB}, which is also the midline.

The period lasts 4 seconds, telling us the pattern of volume alteration repeats every 4 seconds.

b

Evodia was asked to find the volume of the opera singer's voice at 9.5 seconds, to the nearest decibel. She decided to extend the graph model:

Opera singer volume
1
2
3
4
5
6
7
8
9
10
11
12
\text{Seconds, }t
10
20
30
40
50
60
70
80
90
\text{Volume in decibels, }v

Using Evodia's model, interpret the results of finding the volume at 9.5 seconds. Does Evodia's model provide a valid and sufficient answer to the problem? Why or why not?

Worked Solution
Create a strategy

Find the point on the graph of the singer's volume at 9.5 seconds:

Opera singer volume
1
2
3
4
5
6
7
8
9
10
11
12
\text{Seconds, }t
10
20
30
40
50
60
70
80
90
\text{Volume in decibels, }v
Apply the idea

Based on the graph, we can see that at 9.5 seconds, the singer's volume is somewhere between 85 and 87 decibels. The units on the graph do not provide enough precision to determine the volume of the opera singer's voice to the nearest decibel.

c

Create a better model to find the volume of the singer's voice at 9.5 seconds, to the nearest decibel.

Worked Solution
Create a strategy

Other models for a mathematical situation include a diagram, table, equation or expression, or statistical representation. We will build an equation to represent the model, since it can help us find a more precise solution.

First, examine the y-intercept to determine if a sine or cosine curve better fits the graph. Then, identify other key features of the graph that are influenced by a, b, c, and d in the general sinusoidal function y=a \sin \left[ b\left(x - c \right)\right] + d.

Apply the idea

Use a sine function for the graph, since the y-intercept is located at the midline y=82. The midline informs us that there is a vertical translation of 82 units up from the y-intercept of the parent function. We will use that information to construct the function with d=82.

Since there is no horizontal shift in the graph, the value of c remains 0.

The period of the function is 4 seconds, so we know that the b-value can be calculated with the equation \dfrac{2 \pi}{\left|b\right|} = 4.

\displaystyle \dfrac{2 \pi}{\left|b\right|}\displaystyle =\displaystyle 4The period of the function is equal to 4
\displaystyle 2 \pi\displaystyle =\displaystyle 4 \left|b\right|Multiply both sides by \left|b\right|
\displaystyle \dfrac{\pi}{2}\displaystyle =\displaystyle \left|b\right|Divide both sides by 4
\displaystyle \pm \dfrac{\pi}{2}\displaystyle =\displaystyle bEvaluate the absolute value

If b=-\dfrac{\pi}{2}, the graph of the function would be reflected across the y-axis. Since there is no reflection, we know that the b-value is positive, so b= \dfrac{\pi}{2}.

Finally, we know from the graph that the amplitude of the function is no longer 1, which is the amplitude of the parent function. We can use the following equation to calculate the value of a for the amplitude of the given function:\text{amplitude}=\dfrac{1}{2} \left( \text{maximum value} - \text{minimum value} \right) = \dfrac{1}{2} \left(88 - 76 \right) = 6

Using the key features of the graph, we can write the function that represents the volume, v, of the opera singer after t seconds as:v \left( t \right) = 6 \sin \left( \dfrac{\pi}{2} t\right) + 82

Using the function to solve our problem of the singer's voice 9.5 seconds into the section, we have

v \left( 9.5 \right) = 6 \sin \left( \dfrac{\pi}{2} \cdot 9.5\right) + 82 = 86.24

The volume of the singer's voice 9.5 seconds into the section is 86 decibels. Although the equation calculates an answer to multiple decimal places, the original data on which our model was built was precise only to the nearest decibel, so that is the greatest degree of precision we can claim.

By using an equation to model the function, we can be confident that our solution is valid and precise to the nearest decibel.

Reflect and check

We can also use technology to graph the function and a line at t=9.5 seconds and find the point of intersection, accurate to the nearest decibel.

A screenshot of the GeoGebra graphing calculator showing the graphs of v of t equals 6 times sine left parenthesis pi over 2 t right parenthesis plus 82 and t equals 9.5. One of the points of intersection is highlighted. Speak to your teacher for more details.

Example 2

The tide rises and falls in a periodic manner which can be modeled by a trigonometric function. Volodymyr charts tide levels in order to determine when he can sail his ship into a bay and takes the following measurements:

  • Low tide occured at 8 \text{ am}, when the bay was 7 \text{ m} deep.
  • High tide occured at 2 \text{ pm}, when the bay was 15 \text{ m} deep.

Let t be the number of hours passed since low tide was first measured. The following table of values for the tide level, in d meters, models Volodymyr's charting:

\text{Time }(t \text{ in hours})036912
\text{Tide level }(d \text{ in meters})71115117

Volodymyr uses this data to build a function to model for the tide level: d \left(t \right)=-4 \cos \left(\dfrac{\pi}{6} t \right) + 11

a

Verify that the model is a good fit for the data.

Worked Solution
Create a strategy

We can graph the function that Volodymyr created to model the changing tide levels. Then, we can compare the graph to the table of values.

Apply the idea

The following graph can be constructed using the given function to show the change in the tide level since low tide at 8 \text{ am}:

Bay tide levels
1
2
3
4
5
6
7
8
9
10
11
\text{Time in hours, } t
2
4
6
8
10
12
14
16
\text{Tide level in meters, } d

We can see that by including the ordered pairs from the table, the function aligns with the table of values and is a good fit.

We can also interpret what we see in the graph and how it appears in the function {d \left(t \right)=-4 \cos \left(\dfrac{\pi}{6} t \right) + 11} as transformations:

  • The function matches the shape of a cosine function, because the y-intercept is the function's maximum or minimum value

  • Since the amplitude, a= \dfrac{1}{2} \left ( \text{ maximum value}- \text{ minimum value} \right), the amplitude of the function is 4 and since the graph is vertically reflected, a=-4

  • The period of the function is 12 hours, so we find b by solving the equation \dfrac{2 \pi}{\left|b\right|} = 12 and since the graph is not a reflection across the y-axis, the b-value is positive
  • The midline indicates the vertical translation of the graph, so since the midline is at y=11, d=11

Reflect and check

By comparing the two given models to a graphical representation of the data, we can verify that they are a good fit by confirming the consistency between the representations.

b

The ship needs a depth of at least 11.7 \text{ m} to be able to sail in and out of the bay safely. Interpret the model to determine when Volodymyr can sail back into the bay.

Worked Solution
Create a strategy

Since Volodymyr is sailing his ship back into the bay, we know that he has already left the bay. We will assume that Volodymyr left the bay around the time when the water level first rose to at least 11.7 \text{ m} for the day.

Use the graph of the tide level in meters, d, over t hours to determine the amount of time that Volodymyr has to sail his ship back into the bay.

Apply the idea

We can specify the times along the graph when Volodymyr can sail his ship back into the bay:

Bay tide levels
1
2
3
4
5
6
7
8
9
10
11
\text{Time in hours, } t
2
4
6
8
10
12
14
16
\text{Tide level in meters, } d

By looking at the graph of the function where the tide is at least 11.7 \text{ m} after high tide, we can see that the tide stays at a safe depth for Volodymyr's ship from point the time at A to the time at point B.

From the graph we can estimate Volodymyr has a window of approximately 5 hours in which he can sail out of bay and return.

Using technology, we can find points A and B accurately by finding the intersection of the functions y=d\left(t\right) and y=11.7. Doing this we find A\left(3.34, 11.7\right) and B\left(8.66,11.7\right). This gives us a window of 5.32 hours where the depth of the bay is at least 11.7 m deep.

Reflect and check

We can also use the given table in the problem to verify the solution with some confidence, knowing that the tide level is unsafe when t=3 and t=9, but a different model may provide a more precise answer to the problem.

In the real world scenario, Volodymyr will need to leave a little later than point A indicates and return a little earlier than point B to factor in surge and sailing time to safely exit and return to the bay. This should be taken into consideration when making recommendations.

c

Write a report with recommendations for Volodymyr's sailing excursions.

Worked Solution
Create a strategy

We can specify the recommended time(s) of day when it is or is not safe to sail into the bay. We will justify this with the data but avoid too much technical wording and algebraic work that is unecessary for a report. Since we do not have exact points of intersection based on our models, we can provide rough time periods for the report.

Apply the idea

Assuming that Volodymyr's ship is docked in the bay each night, the following information will be relevant to him:

Bay tide levels
1
2
3
4
5
6
7
8
9
10
11
\text{Time in hours since } 8 \text{ am, } t
2
4
6
8
10
12
14
16
\text{Tide level in meters, } d

Low tide occurs at 8 \text{ am}, and the water at that time is 7 \text{ m} deep which is too shallow for Volodymyr's ship to sail out of the bay.

By 11\text{:}30 \text{ am}, the water in the bay is 12 \text{ m} deep. This would be a good time to sail out of the bay.

The tide will bring the water back to 12 \text{ m} by 4\text{:}30 \text{ pm}, so sailing back into the bay before time is necessary in order to keep the ship from getting stuck in the sand or mud in the bay.

If an excursion will take longer than 5 hours, it would be necessary for Volodymyr to do one of the following:

  • Extend his trip to the next time that the bay is about 11.7 \text{ m} deep

  • Dock his boat in another bay that is deeper than the required 11.7 \text{ m}

Reflect and check

Once we have all the information, we need to report on our recommendations, making sure to include the assumptions and reasoning that led to the decision.

Idea summary

After working through the entire modeling cycle, which may include interpreting results and verifying our model, we generally need to report our findings. Some things to note when writing a report:

Reporting with a model includes:

  • Information that is relevant to the audience

  • Enough detail that the audience understands the reasoning behind any recommendations

Reporting a model does not include:

  • Technical algebraic work

  • Mathematical jargon that could confuse the audience

Outcomes

F.BF.A.1

Write a function that describes a relationship between two quantities.

F.TF.B.5

Choose trigonometric functions to model periodic phenomena with specified amplitude, frequency, and midline.

What is Mathspace

About Mathspace