
Systems of Inequalities in Two Variables
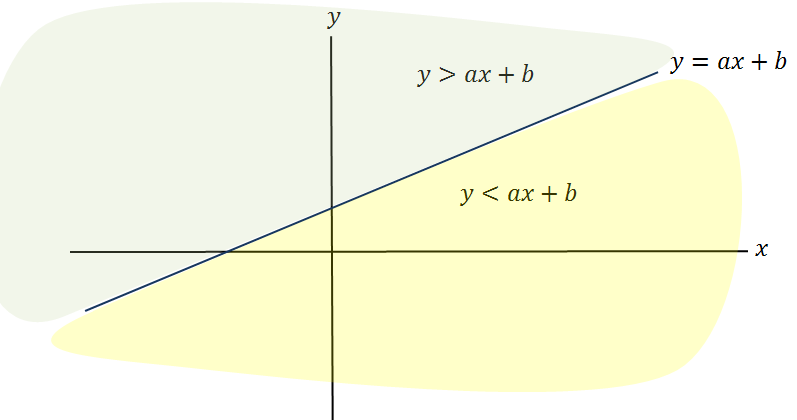
A linear equation in the form $y=ax+b$y=ax+b has a line as its graph. The line has gradient $a$a and $y$y-intercept $b$b.
If the '$=$=' sign is replaced by '$<$<' or '$>$>', that is, 'less than' or 'greater than', we obtain a linear inequality:
$y\
The set of points that satisfy a linear inequality is a half-plane bounded by the line $y=ax+b$y=ax+b. We will often need to determine on which side of this line the region lies that contains the points satisfying the inequality.
When two or more different inequalities are to be satisfied together, the solution set is further restricted. For example, suppose we require $y

The required region is the intersection of the two half-planes defined by the inequalities.
Note that the boundaries have been drawn as dotted lines. This is because the points that satisfy $y=x+1$y=x+1 do not satisfy the strict inequality $y
An inequality may be written in the form $ax+by\le k$ax+by≤k. For example, $2x-y\le10$2x−y≤10.
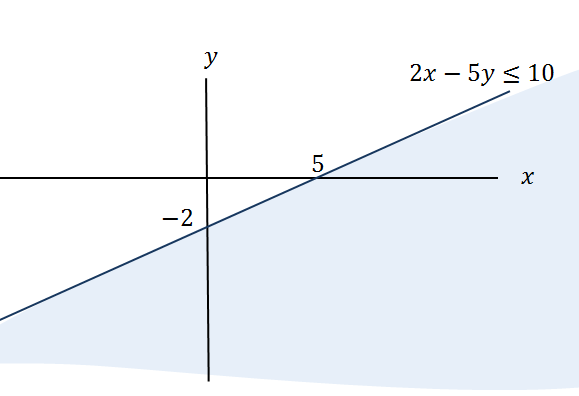
The region of points that satisfy all the inequalities in a system of inequalities is often called the feasible region. To decide which side of a boundary line given in the form above is the feasible side, we can choose a test point that is known to be on one or the other side of the boundary line and then check whether the point satisfies the inequality. If it does, the point is in the feasible region and the feasible side of the boundary line has been identified.
An obvious and easy test point to use is the origin $(0,0)$(0,0) but this will not work for lines that pass through the origin.
In the diagram above, the infeasible region has been shaded. This is a useful practice because if several inequalities that are to be satisfied simultaneously are shown on one diagram and the infeasible regions are shaded, then the remaining unshaded region will represent the required solution set.
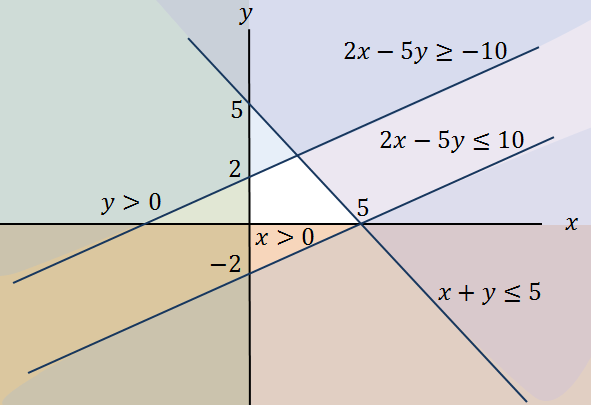
The following diagram illustrates a system of five linear inequalities. The feasible region is left unshaded.
Worked Examples
Question 1
Select the inequalities that describe the shaded region.
A coordinate plane, with the x-axis from -10 to 10 and the y-axis also from -10 to 10. Two lines are drawn on the plane: a $dashed$dashed vertical line which crosses the x-axis at $\left(1,0\right)$(1,0) and a $solid$solid horizontal line which crosses the y-axis at $\left(0,3\right)$(0,3). These lines divide the coordinate plane into four regions, and the $\text{lower left}$lower left region is shaded.
$x$x$\le$≤$1$1 and $y$y$<$<$3$3
A$x$x$<$<$3$3 or $y$y$\le$≤$1$1
B$x$x$<$<$3$3 and $y$y$\le$≤$1$1
C$x$x$\le$≤$1$1 or $y$y$<$<$3$3
D$x$x$<$<$1$1 or $y$y$\le$≤$3$3
E$x$x$<$<$1$1 and $y$y$\le$≤$3$3
F
Question 2
Sketch a graph of the system of inequalities $x$x$\le$≤$5$5 and $y$y$<$<$3$3.
- Loading Graph...
Question 3
Consider the system of inequalities.
$2x-y$2x−y$<$<$4$4
$6x+3y$6x+3y$>$>$0$0
Determine the $x$x- and $y$y-intercepts of the lines $2x-y=4$2x−y=4 and $6x+3y=0$6x+3y=0.
$2x-y=4$2x−y=4 $6x+3y=0$6x+3y=0 $x$x-intercept $\left(\editable{},0\right)$(,0) $\left(\editable{},0\right)$(,0) $y$y-intercept $\left(0,\editable{}\right)$(0,) $\left(0,\editable{}\right)$(0,) Sketch the system of equations on the same set of axes below.
$2x-y=4$2x−y=4
$6x+3y=0$6x+3y=0
Loading Graph...Which of the following points satisfies the system of inequalities?
$\left(-4,-3\right)$(−4,−3)
A$\left(2,2\right)$(2,2)
B$\left(5,0\right)$(5,0)
C$\left(2,-7\right)$(2,−7)
DPlot a graph of the solution set to the system of inequalities on the same axes below.
Loading Graph...