
Pearson's correlation coefficient
Pearson's correlation coefficient is a value that tells you the strength of the linear relationship between two variables. It is denoted by the letter $r$r. It indicates how closely a scatterplot conforms to a straight line.
The value of $r$r ranges from $-1$−1 to $1$1 on a continuum like this.

If the $r$r-value is $0$0, we say there is no correlation. If the $r$r-value is $1$1 or $-1$−1 we say the correlation is perfect.
We looked at examples of the different descriptions of correlation in the previous lesson:
Positive correlations
 |
 |
 |
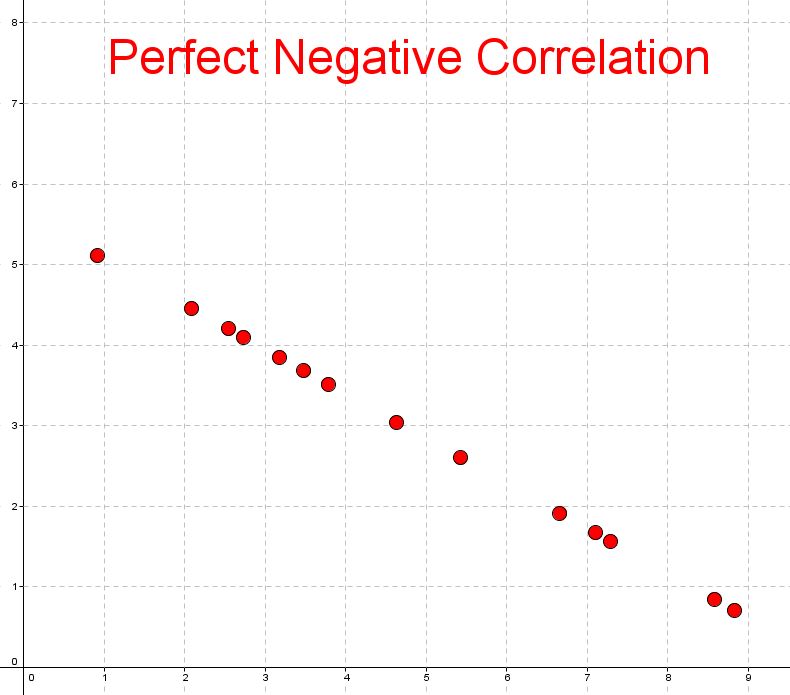
Negative correlations
 |
 |
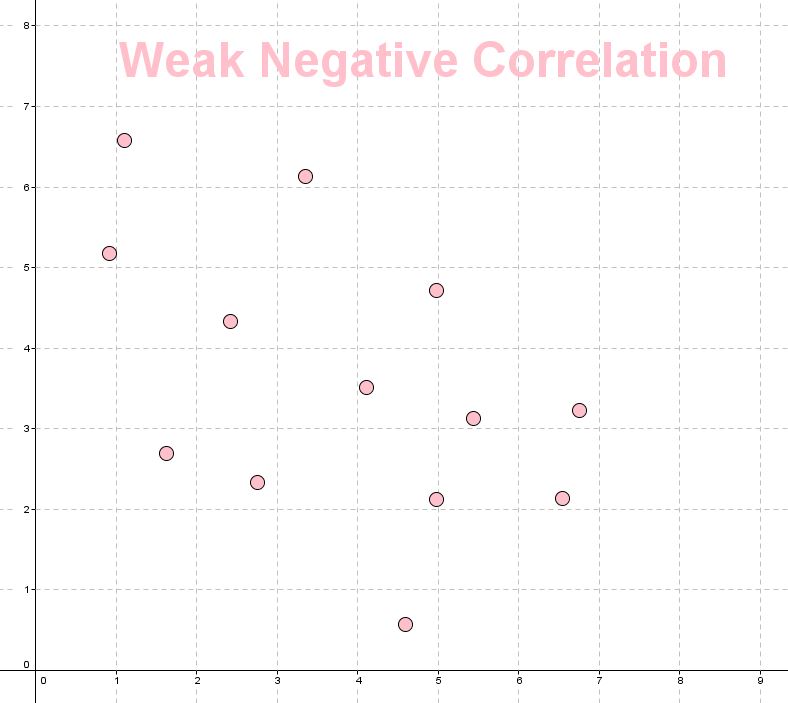 |
A weak correlation, indicates there is some correlation but it is not considered to be very significant. Values from $0$0 to $0.5$0.5 or from $-0.5$−0.5 to $0$0 are generally considered weak.
A strong correlation indicates that the connection between the variables is quite significant. Values from approximately $0.8$0.8 to $1$1 or from $-1$−1 to $-0.8$−0.8 are strong.
A moderate correlation falls between weak or strong. Values from approximately $0.5$0.5 to $0.8$0.8 or from $-0.8$−0.8 to $-0.5$−0.5 are considered moderate.

Correlation applet
Play with this applet to see how the correlation coefficient changes. Move each point. Try having one outlier and see how much that can change the correlation coefficient. Try moving the points so they are in a perfect straight line. What happens to the correlation coefficient value?
1. State the direction of the relationship. Use the words positive or negative. (Think about the gradient of the line).
2. Describe the strength of the relationship. Use the $r$r value to determine if the relationship is perfect, weak, moderate, strong or no correlation.
3. State the shape of the relationship. Pearson's correlation coefficient gives a measure of how close the points are to being a straight line, so we almost always use the word linear. It is possible for two variables to be related in a non-linear way. For example, the scatterplot may resemble a parabola more than it resembles a line. If there seems to be a pattern but it does not look like a line we say the relationship appears to be non-linear.
Practice questions
question 1
A pair of data sets have a correlation coefficient of $\frac{1}{10}$110 while a second pair of data sets have a correlation coefficient of $\frac{3}{5}$35.
The first pair of data sets have a stronger correlation
AThe second pair of data sets have a stronger correlation
B
question 2
The scatter diagram shows data of the height of an object after it is pushed off a rooftop as a function of time.
Which type of model is appropriate for the data?
Linear
AQuadratic
BThe most likely value of Pearson’s correlation coefficient ($r$r) for this set of data is
$0.93$0.93
A$-0.68$−0.68
B$-0.11$−0.11
C$0.34$0.34
D
Drawing conclusions from correlation
If we determine that there is some correlation between variables, we can make conclusions about the scenario that is being modelled. However, we can only draw conclusions based on the data and do not want to assume anything about the relationship itself.
For this reason, when we make conclusions we should be careful to use wording that describes the data. For example, if there is a strong negative correlation between two variables, we can draw the conclusion that: "As the explanatory variable increases, the response variable increases".
Even when two variables have a strong relationship and $r$r is close to $1$1 or $-1$−1, we cannot say that one variable causes change in the other variable. If asked "does change in the explanatory variable cause change in response variable?" we always write "No - correlation is not causation".
A strong correlation might seem to indicate a cause and effect relationships between the variables. However, we need to be careful to understand the situation, as this is not always the case.
These are common reasons for correlation between variables without a causal relationship:
- Confounding due to a common response to another variable (also described as contributing variables).
- e.g. sales of ice-creams and sunscreens have a strong positive correlation because they both increase in response to hot summer weather.
- Coincidence
- It is possible that the data we are analysing shows a correlation purely by chance.
- A website containing graphs of variables with spurious correlations can be found here.
- The causation is in the opposite direction
- e.g. strong winds are correlated to tree branches waving. But the waving branches don't cause the strong winds, instead it's the other way around.
When we are asked to analyse a relationship between variables, we should consider whether a causal relationship can be justified. If not, we should say so, and identify possible non-causal reasons for the association.
Practice questions
question 3
A survey was run to collect data on the number of hats being worn at school each day, compared to the temperature of that day. The $r$r-value for the scattergraph was $0.68$0.68, including any outliers.
Select the conclusion that is best described by the data collected.
When the temperature increases, more people wear hats.
AWhen the temperature increases, less people wear hats.
BAs the temperature increases, the number of hats being worn increases.
CAs the temperature increases, the number of hats being worn decreases.
DThere is no correlation between the temperature and the number of hats being worn.EOne of the surveyors suggests that both the temperature and number of hats being worn are higher on sunny days. What conclusion is being presented?
There is a causal relationship between the temperature and number of hats being worn when it is sunny.
ABoth the temperature and number of hats being worn are perfectly correlated with how sunny it is.
BSunny days are a confounding variable for the temperature and number of hats being worn.
CIt is a coincidence that temperature and the number of hats being worn are correlated.
D
question 4
A research determines that there is a causal relationship between smoking and getting cancer.
Will there be correlation between smoking and getting cancer?
Yes
ANo
BNot enough information
C
question 5
A study found a strong correlation between the approximate number of pirates out at sea and the average world temperature.
Does this mean that the number of pirates out at sea has an impact on world temperature?
Yes
ANo
BWhich of the following is the most likely explanation for the strong correlation?
Contributing variables - there are other causal relationships and variables that come in to play and these may lead to an indirect positive association between the approximate number of pirates out at sea and the average world temperature.
ACoincidence - there are no other contributing factors or reasonable arguments to be made for the strong positive association between the approximate number of pirates out at sea and the average world temperature.
BWhich of the following is demonstrated by the strong correlation between the approximate number of pirates out at sea and the average world temperature?
If there is correlation between two variables, then there must be causation.
AIf there is correlation between two variables, there isn't necessarily causation.
BIf there is correlation between two variables, then there is no causation.
C