
When the same measurement is made on many similar items, the recorded results are what we call a univariate data set.
For example, the amount of learning students do in maths can be measured by a test, and the results of the whole class are a univariate data set. Another example is mass-production in a manufacturing process - like the amount of milk in a bottle, or the length of a t-shirt. The measurements will vary around a mean value and (if the process is working correctly!) the values will not be too far above or below the mean.
Most of the measurements will be clustered close to the mean value, so the values close to the mean will have large frequencies. As the values move further from the mean in either direction, their frequencies will decrease. Results of this kind displayed in a histogram show a central peak with columns of decreasing height on each side of the mean.
 |
| A histogram of measurements and a symmetric, bell-shaped curve approximating the histogram |
If a data set is symmetric and bell-shaped about the mean, we say it has an approximate normal distribution. It is always an approximation, because the columns can never be thin enough to make a continuous curve, as shown in the graph above. Still, studying normal distributions will provide a lot of interesting insight into the way univariate data works.
You may have heard of a bell curve, which is a term for the graphical representation of a normal distribution. From the surface area of people's skin, to the weight of bread rolls from a bakery, even the amount of time you spend waiting on hold for technical support, these measurements all form data sets that are roughly normally distributed.
Two important values are needed to graph or interpret a normal distribution: the mean and the standard deviation.
The mean, written $\overline{x}$x, is the average of the data values, and also represents the place of maximum density - where the curve is highest. The curve is symmetric about the mean, and in a normally distributed data set, the mean, median and mode all have the same value.
The standard deviation, written $s$s, represents the spread of the data. This will affect how wide and how tall the normal distribution is when graphed.
- The lower the standard deviation, the more clustered the scores will be around the mean, leading to a narrower and taller bell.
- The larger the standard deviation, the more spread out the scores, leading to a flat, low bell.
Exploration
The normal distribution curve shown in the graph below represents a data set with a very small standard deviation of $0.2$0.2, and hence is clustered tightly around the mean.

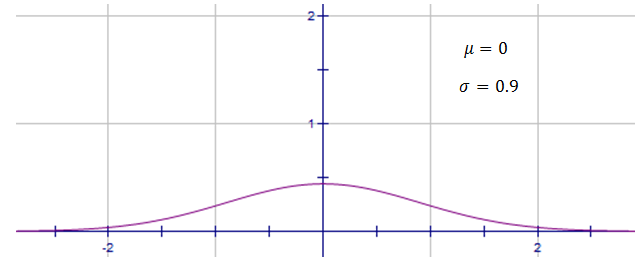
This normal distribution here represents a data set with a larger standard deviation of $0.9$0.9, and is very spread out.
When identifying or drawing a normal distribution curve, it is useful to know that the normal distribution
- is bell-shaped
- is symmetric around (or centred around) the mean $\overline{x}$x
- has mean, median and mode all equal.
The standard deviation $s$s indicates the spread of the scores. The higher the standard deviation, the more spread out the scores and the flatter the curve.
Practice Questions
question 1
The lengths of Marlin are approximately normally distributed, with an average length of $230$230 cm. The standard deviation is $40$40 cm.
The points marked on the horizontal axis of each distribution below are separated by $1$1 standard deviation. Which one shows the distribution of marlin lengths?
 A
A B
B C
C D
D
question 2
The heights of players in a basketball team are approximately normally distributed with an average height of $176.5$176.5 cm.
What is the median height of the players in centimetres?
question 3
The weight of avocados at a grocery store is approximately normally distributed. The average weight is $150$150 g. The points marked on the horizontal axis are separated by $1$1 standard deviation.

What is the standard deviation of the weight of avocados in grams?
What is the value of $x$x on the graph?
What is the value of $y$y on the graph?