
Solve Linear Inequalities from a Graph
Previously, we learnt how to solve linear inequalities. Remember that a linear inequality in $x$x will not involve $x^2$x2, $x^3$x3, $\frac{1}{x}$1x, or anything else. It will only ever involve $x$x being multiplied or divided by constants, or having constants added or subtracted.
In other words, the left hand side and right hand side of a linear equality will both be lines!
Think about it. If we have the linear inequality $3x-5<-5x+11$3x−5<−5x+11, the left hand side is the line $y_1=3x-5$y1=3x−5 and the right hand side is the line $y_2=-5x+11$y2=−5x+11.
We could solve the inequality algebraically like this.
| $3x-5$3x−5 | $<$< | $-5x+11$−5x+11 | |
| $8x-5$8x−5 | $<$< | $11$11 | Add $5x$5x to both sides |
| $8x$8x | $<$< | $16$16 | Add $5$5 to both sides |
| $x$x | $<$< | $2$2 | Divide both sides by $8$8. |
Or, we could realise that to solve $3x-5<-5x+11$3x−5<−5x+11 we just need to find for what values of $x$x the line $y_1=3x-5$y1=3x−5 is less than $y_2=-5x+11$y2=−5x+11.
We can graph both lines like this.
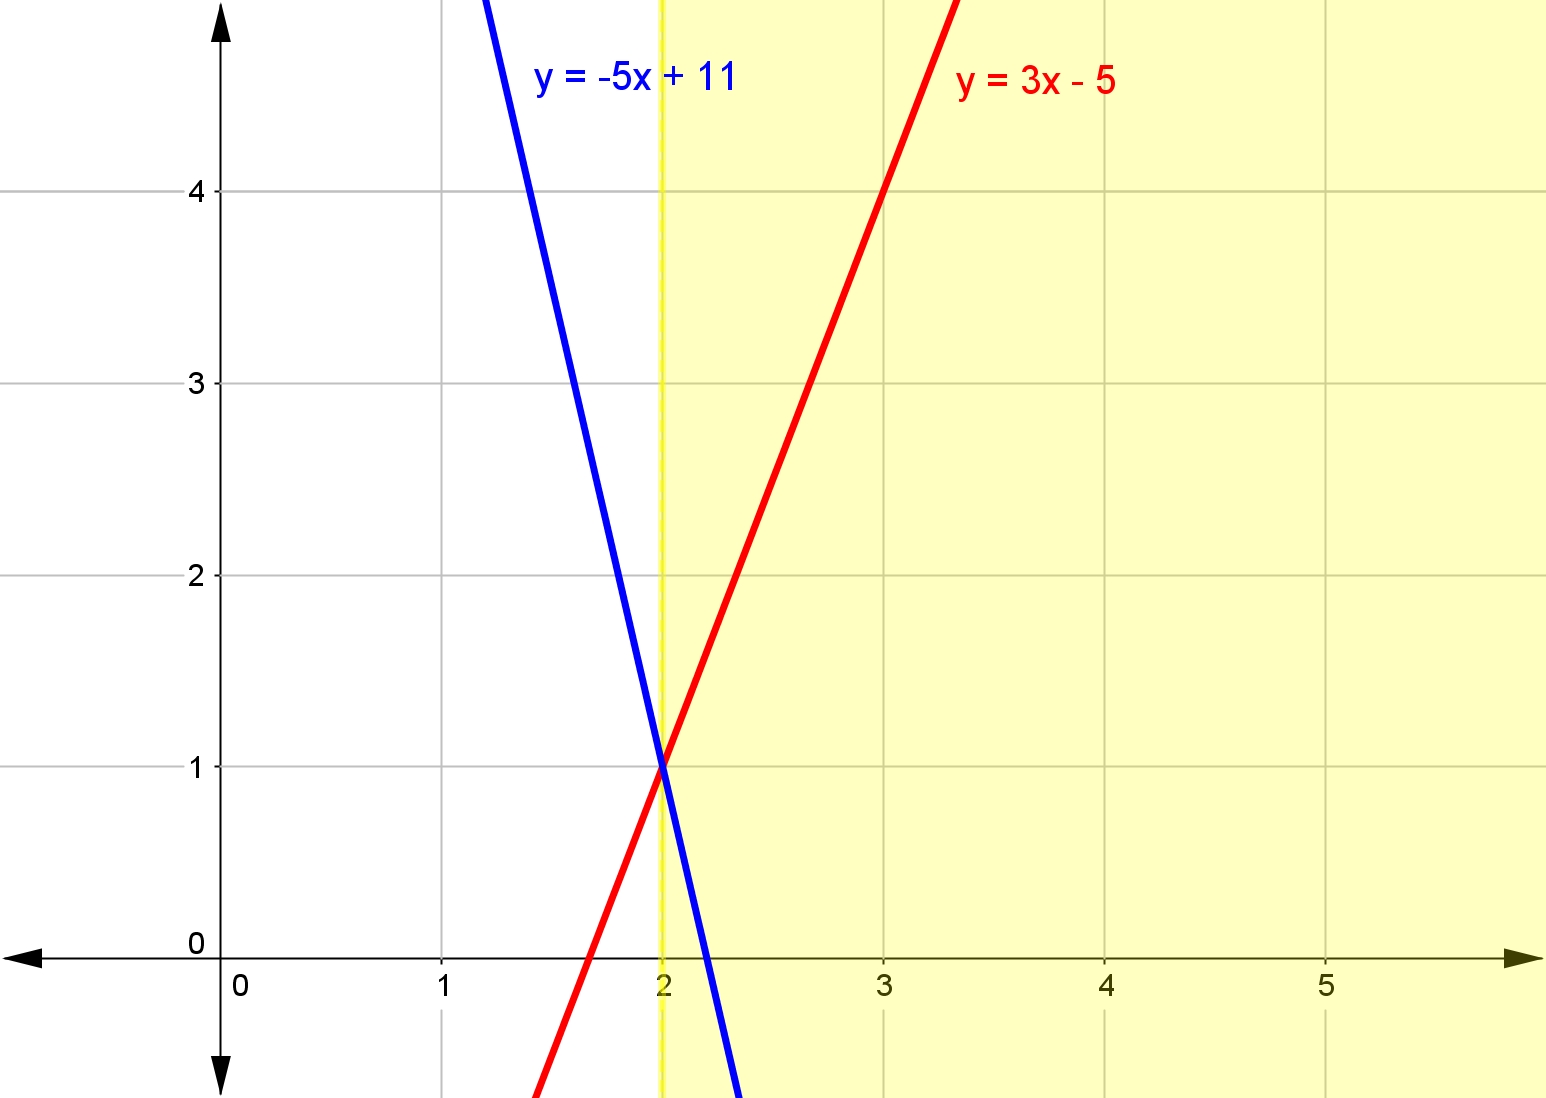
For what values of $x$x is the line $y_1=3x-5$y1=3x−5 less than $y_2=-5x+11$y2=−5x+11? In other words, when is the line $y_1=3x-5$y1=3x−5 below the line $y_2=-5x+11$y2=−5x+11?
Just as we found by solving the inequality algebraically, $y_1$y1 is below $y_2$y2 for $x<2$x<2.
Worked Examples
Question 1
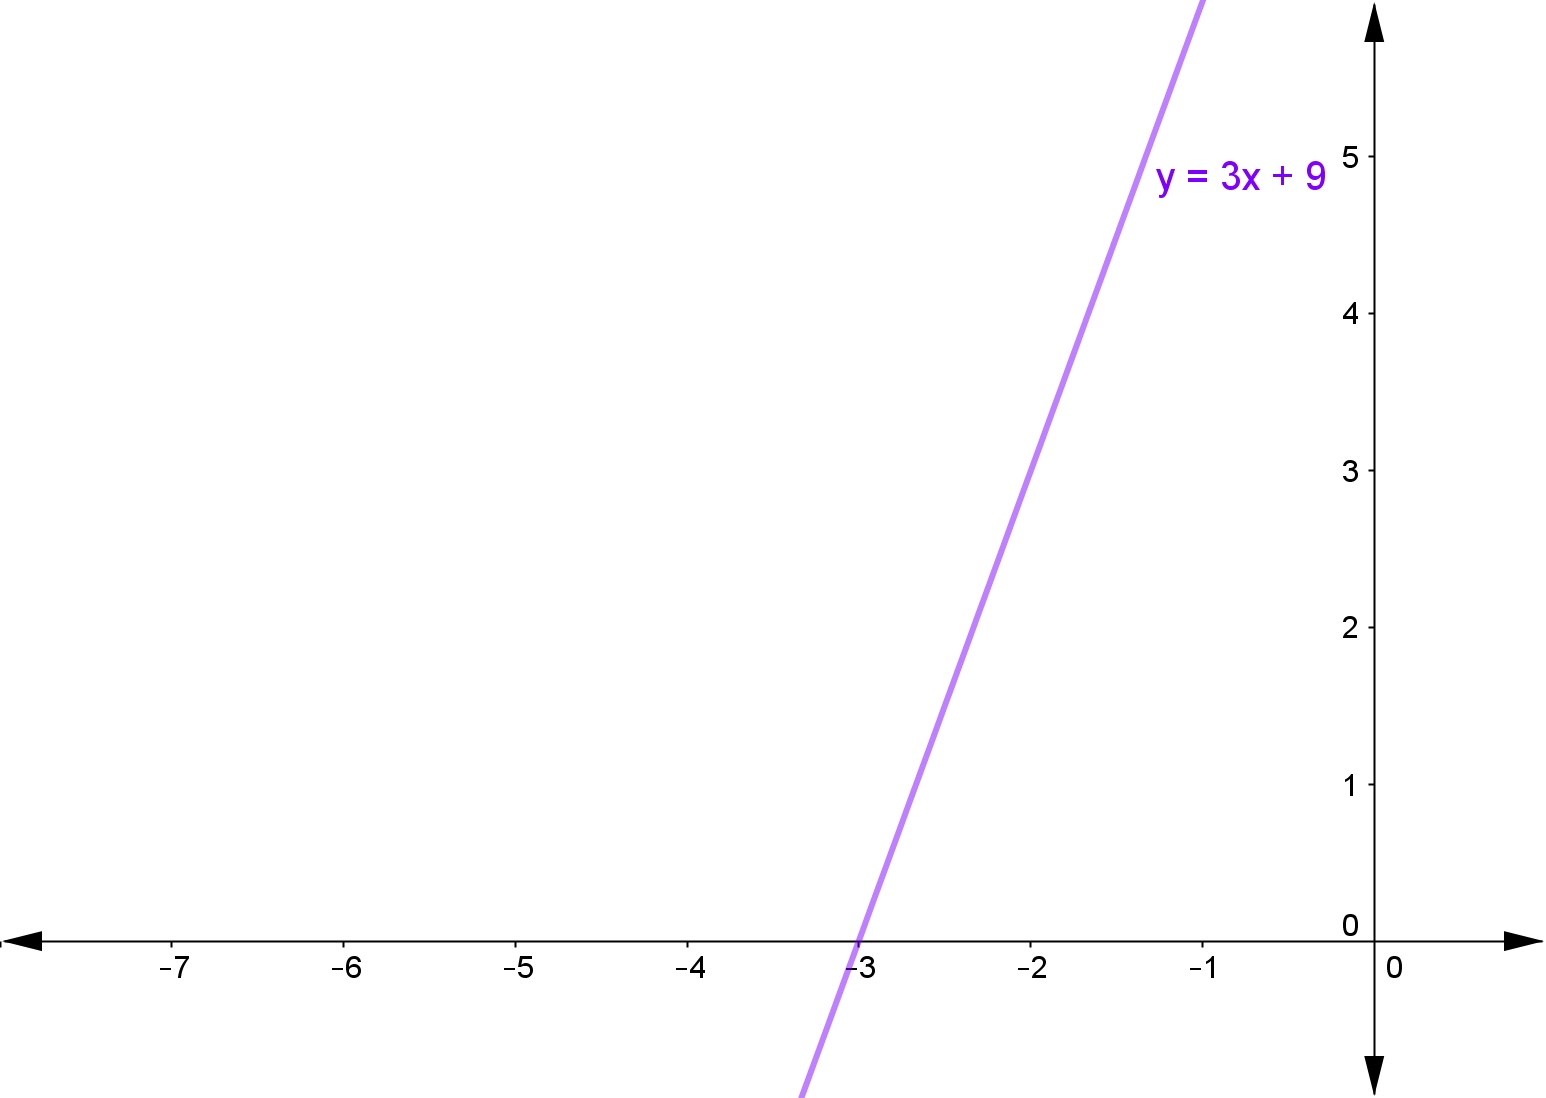
Using the above graph, state the solution to the linear inequality $3x+9\ge0$3x+9≥0 and plot the solution on a number line.
The solution to the inequality $3x+9\ge0$3x+9≥0 will be whenever the line $y=3x+9$y=3x+9 is above the line $y=0$y=0 (the $x$x-axis), in other words, when the line is positive.
We can see that this happens when $x\ge-3$x≥−3, which we can plot on the number line like this.

Question 2

Using the above graph, state the solution to the linear inequality $3x-21<9$3x−21<9 and plot the solution on a number line.
The solution to the inequality $3x-21<9$3x−21<9 will be whenever the line $y=3x-21$y=3x−21 is below the line $y=9$y=9.
We can see that this happens when $x<10$x<10, which we can plot on the number line like this.

Worked Examples
Question 1
Consider the graph of $y=x+6$y=x+6.
Using the graph, state the solution of the inequality $x+6<0$x+6<0.
Give your answer in interval notation.
Question 2
Consider the graphs of $y=-23$y=−23 and $y=4x-3$y=4x−3.
Using the graphs, state the solution of the inequality $4x-3<-23$4x−3<−23. Give your answer in interval notation.
Question 3
To solve the inequality $x\le\frac{x-3}{4}-1$x≤x−34−1, Tracy graphed $y=x-3$y=x−3. What other line would she need to graph to be able to solve the inequality graphically?
$y=4x+1$y=4x+1
A$y=\frac{x-3}{4}-1$y=x−34−1
B$y=x$y=x
C$y=4x+4$y=4x+4
D