
Two Categorical Variables
We've already looked at how we can use a table to display data we collect. Normally this is based on one group who may answer in a certain number of ways. For example, you could ask everyone in your class to choose their favourite type of juice and display your results in a graph or table, such as the one below.
| Type of Juice | Number of People |
|---|---|
| Apple | $12$12 |
| Pineapple | $4$4 |
| Orange | $8$8 |
| Tropical | $5$5 |
But what would we do if we wanted to know whether there were differences in juice preferences between boys and girls? Well, we would need to create a two-way table. Let's learn how to do this.
Let's recap the video:
To create a two-way table, we list the different groups along one side of the table and the different categories on the other, like so:
| Type of Juice | Boys | Girls |
|---|---|---|
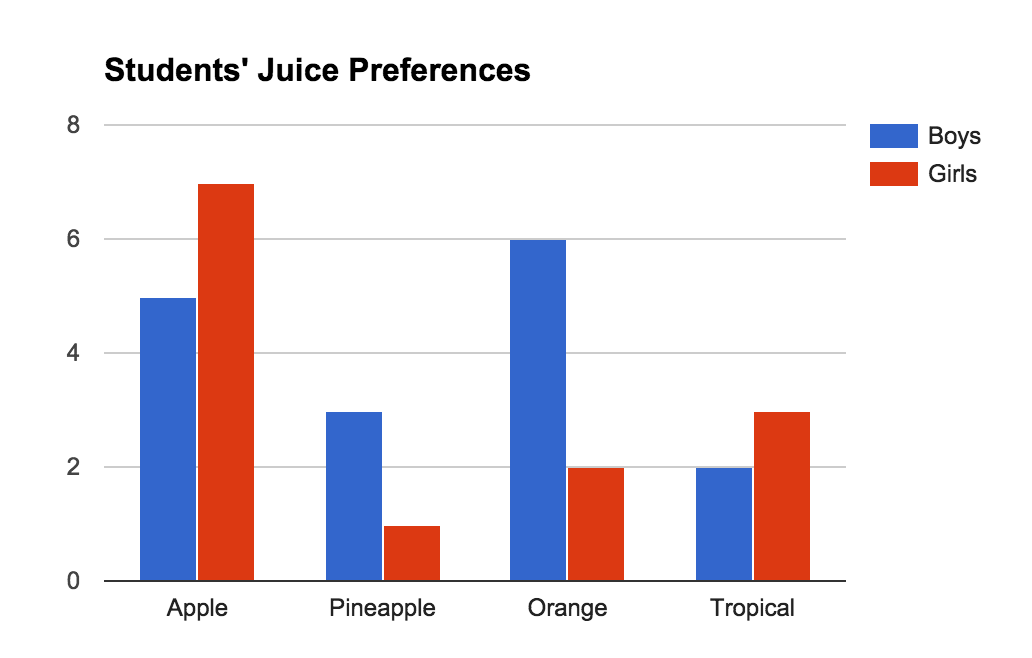
| Apple | $5$5 | $7$7 |
| Pineapple | $3$3 | $1$1 |
| Orange | $6$6 | $2$2 |
| Tropical | $2$2 | $3$3 |
Notice how the two groups, boy and girls, are the headings for the columns and each variable (i.e. each type of juice) is a separate heading for each row? Now we get even more information! For example, I can say apple juice was preferred by most girls ($7$7 girls picked it), while most boys preferred orange juice ($6$6 picked it). Or I could say $2$2 more boys preferred pineapple juice than girls (because $3-1=2$3−1=2).
We can also display our results in a graph, with the two groups side-by-side, like in the column graph below:
Worked Examples
Question 1
Mr. Westwood asked the students in his class to pick whether they prefer swimming or cycling. He displayed the results in a two-way table.
| Boys | Girls | |
|---|---|---|
| Swimming | $11$11 | $14$14 |
| Cycling | $7$7 | $11$11 |
How many boys picked swimming?
How many girls picked cycling?
Did more boys prefer swimming or cycling?
Swimming
ACycling
B
Question 2
Maximilian asked his staff which mode of transport they took to work. He displayed his results in a two-way table.
| Males | Females | |
|---|---|---|
| Train | $12$12 | $17$17 |
| Bus | $19$19 | $9$9 |
How many males caught the bus?
How many more females caught the train than the females that caught the bus?
How many males did Maximilian survey in total?