
A travel graph shows the distance travelled along a fixed route against the time elapsed. The distance is measured from a given starting point on the route with the distance measurements following any kinks or bends in the path taken.
A related but different kind of graph involving distance and time is called a displacement-time graph. In this, the distances are measured from a fixed point in a direct line and they take no account of the twists and turns in the route taken.
In this lesson, we restrict our attention to the information that can be encoded in a travel graph.
The following diagram shows a map with the path taken by a traveller. The route is divided into sections A, B, C and D. We will imagine that the arrows alongside the path represent equal amounts of time spent travelling along the corresponding section of road.
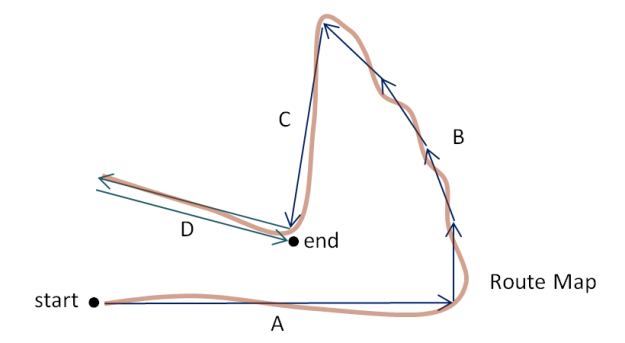
The arrows are of different lengths but each represents the same amount of time. So, we see that the traveller is moving fastest in section A and slowest in each of the four parts of section B. When the time and distance information is displayed in the form of a travel graph, these changes of speed will appear as changes in the gradient of the graph. The following table shows the times and distances over each of the individual arrowed sections.
| A | B | C | D | |
|---|---|---|---|---|
| time (h) | $2.0$2.0 | $2.0$2.0, $2.0$2.0, $2.0$2.0, $2.0$2.0 | $2.0$2.0 | $2.0$2.0, $2.0$2.0 |
| distance (km) | $180$180 | $45$45, $45$45, $45$45, $45$45 | $120$120 | $105$105, $105$105 |
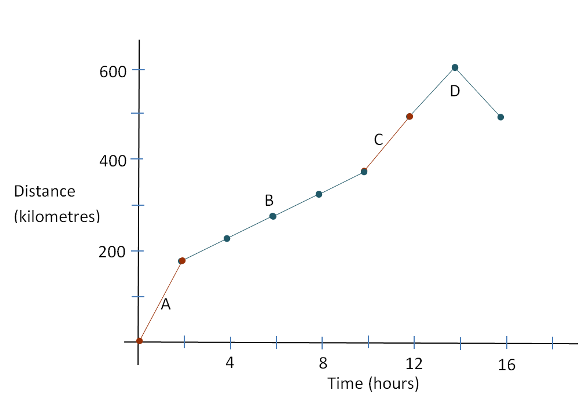
Below, this time-and-distance information is converted to graphical form. You should check to see how each part of the graph matches the information in the table and in the route map.
Example
In the travel graph above, what is the significance of the downward sloping segment between hours $14$14 and $16$16?
The traveller has reversed direction on the path and so, is reducing the distance from the starting point. In this sense, the speed is negative and therefore, the slope of the graph is negative in this section.
More Worked Examples
QUESTION 1
The graph shown describes Frank's distance from home throughout his journey.
| Distance From Home | |

|
Loading Graph... |
| Time (am) |
How far was Frank from home when he started driving at $5$5 am?
How far was he from home by $7$7 am?
How long did he take to rest?
How far did he travel between $7$7 am and $9$9 am?
Was Frank travelling faster in the first two hours (between $5$5 am and $7$7 am) or the last two hours (between $8$8 am and $10$10 am) of his trip?
First two hours
ALast two hours
B
QUESTION 2
Ken starts travelling at $9$9 am from point $A$A and moves towards point $B$B in a straight line.
The distance between Ken and point $B$B at various times in his journey is shown on the graph below.

How far is point $B$B from point $A$A?
How many hours was Ken's journey from point $A$A to point $B$B?
Between what times did Ken travel at the fastest speed?
$2:30$2:30 pm $-$− $4$4 pm
A$12$12 pm $-$− $1:30$1:30 pm
B$9$9 am $-$− $10$10 am
C$10$10 am $-$− $12$12 pm
D$1:30$1:30 pm $-$− $2$2 pm
EWhat was Ken's fastest speed in km/h?
What was the distance in kilometres travelled by Ken between $1:30$1:30 pm and $4$4 pm?
What is the total distance travelled by Ken from $9$9 am to $4$4 pm?