9.03 Normal distributions
Introduction
In Algebra 1 lesson 7.03 Measures of spread , we learned how the mean and standard deviation of a data set affect its distribution. In Algebra 1 lesson, 7.04 Interpreting data distributions , we learned how to describe the shape of a data distribution. We will use concepts from those lessons to identity symmetric distributions. In this lesson, we will learn special properties related to symmetric distributions.
Normal distribution
A data set that is symmetric and bell-shaped about the mean is said to have an approximately normal distribution.
In the distribution above, the peak of the data represents the mean, the median, and the mode. All these measures of central tendency are equal for this symmetrical distribution.
If a data set is not symmetrical about the mean, we cannot use normal distribution to interpret it. Recall from Algebra 1 that data sets that are not symmetric are skewed.
The shape of the normal distribution will depend on the population parameters: the mean, denoted by \mu, and the standard deviation, denoted by \sigma. The standard deviation describes the spread of the data.
Exploration
Match each of the histograms pictured below to the correct mean and standard deviation.
Justify your choices.
- \mu=16, \sigma=3
- \mu=15,\sigma=2
- \mu=19,\sigma=4
- \mu=18,\sigma=2
In a density curve, the area beneath the curve represents probability with the area under the entire curve equal to 100\%, or 1. When data is approximately normally distributed, the probability between 1, 2, and 3 standard deviations can be accurately summarized using the empirical rule.
Examples
Example 1
Determine whether the following distributions are normally distributed.
| Leaf | |
|---|---|
| 1 | 6\ 7\ 7 |
| 2 | 2\ 2\ 2\ 2\ 3\ 3\ 3 |
| 3 | 3\ 3\ 3\ 6\ 6\ 6\ 7\ 7\ 7\ 7\ 7 |
| 4 | 4\ 4\ 4\ 4\ 4\ 4 |
| 5 | 7\ 7 |
Key: 2 \vert 3 = 23
Example 2
The grades on a recent exam are approximately normally distributed with a mean score of 72 and a standard deviation of 4.
Construct a normal curve and label the boundaries for the empirical rule.
Find the percentage of students who scored between 64 and 68 on the exam.
If 32 students took the exam, determine the number of students expected to score 80 or more on the exam.
A data set that is symmetric and bell-shaped is said to have an approximately normal distribution. The mean, median, and mode are equal in a normal distribution.
The center of the normal distribution is at the population mean, \mu. The population standard deviation \sigma, describes the spread of the data.
The area beneath the normal density curve represents probability with the area under the entire curve equal to 100\%, or 1. The probability between 1, 2, and 3 standard deviations can be accurately summarized using the empirical rule.
Normal distribution with z-scores
To directly compare multiple normally distributed data sets, we need a common unit of measurement. In statistics involving the normal distribution, we use the number of standard deviations away from the mean as a standardized unit of measurement called a z-score.
We can use z-scores along with the standard normal curve to compare values from different sets of data.
For example, a data set that is normally distributed with a mean of 1010 and a standard deviation of 20 can be standardized with z-scores. This would allow us to compare other sets of similar data with a different mean and standard deviation.
To find the z-score of a data value, we must know the mean and standard deviation. If we know those values, we can use the following formula to find the equivalent z-score.
A positive z-score indicates the data value was above the mean.
A z-score of 0 indicates the data value was equal to the mean.
- A negative z-score indicates the data value was below the mean.
The larger the magnitude of the z-score, the further the score is from the mean.
Examples
Example 3
An extreme amusement park ride only allows riders over 60 inches tall to ride. The height of an average American male is normally distributed with a mean of 70 inches and a standard deviation of 3 inches, and the height of an average American female is normally distributed with a mean of 62.5 inches and a standard deviation of 2.5 inches.
Find and interpret the z-score for the 60-inch height requirement relative to the average American male heights.
Find and interpret the z-score for the 60-inch height requirement relative to the average American female heights.
Compare the percentage of male riders who can ride this ride to the percentage of female riders who can ride.
Example 4
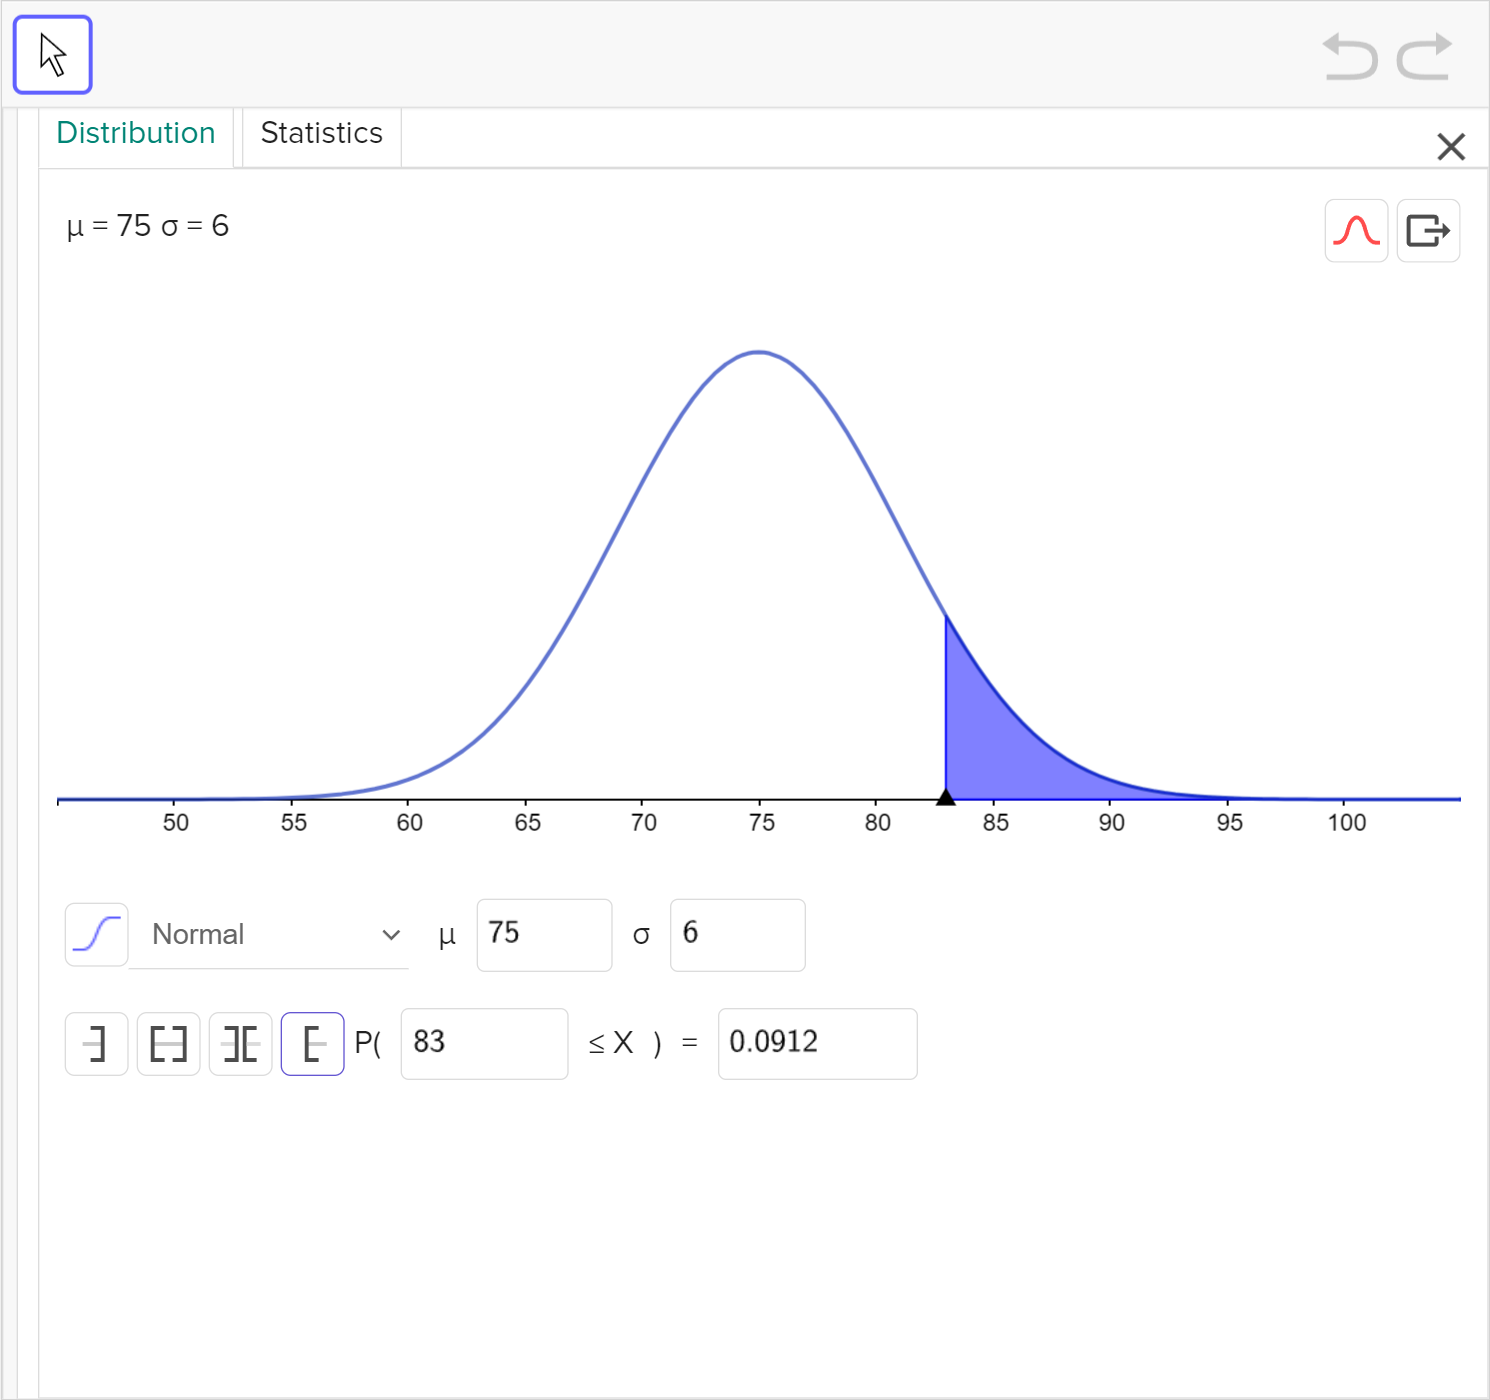
A sprinter is training for a national competition. She runs 400\text{ m} in an average time of 75 seconds, with a standard deviation of 6 seconds.
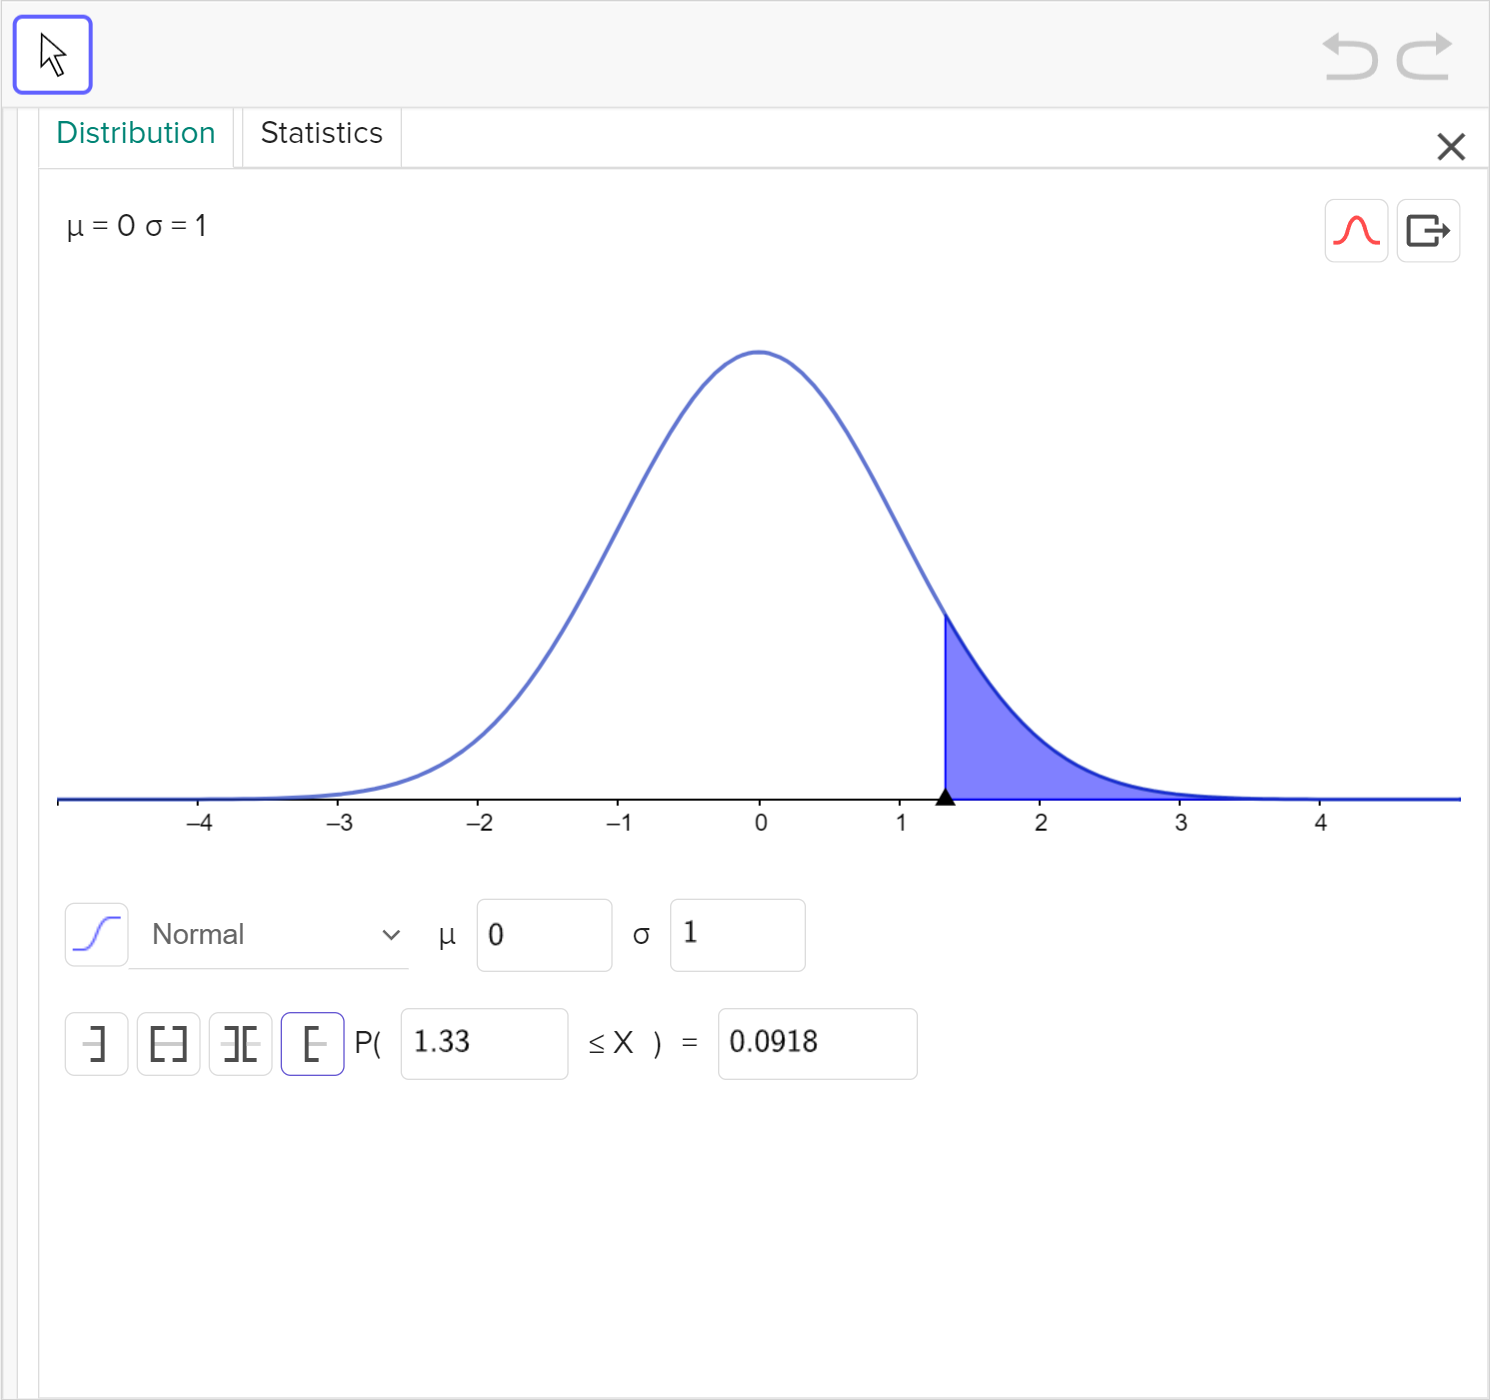
Determine the z-score of a time of 83 seconds. Round your answer to two decimal places.
The table below shows the area under the standard normal curve to the left of a given z-score. Use the table to find the probability that it takes the runner more than 83 seconds to run 400\text{ m}.
Use technology to verify your answer.
Data that is normally distributed can be normalized using z-scores. This allows us to compare data sets that have different means and standard deviations.
To find the z-score of a data value, we must know the mean and standard deviation. If we know those values, we can use the following formula to find the equivalent z-score.


