topic badge

5.01 Rational functions

Introduction

This lesson introduces the concept of inverse variation and then builds upon it to teach reciprocal functions, which are further developed into rational expressions, functions, and equations. We will have the opportunity to develop our understanding of the key features of functions, particularly domain, in both an algebraic and graphical setting.

Inverse variation

Exploration

Tamar plans to bike 13 miles.

  1. Construct a table of values for t\left(r\right), the amount of time it takes Tamar to bike if he rides at a rate of 1 \text{ mph}, 8 \text{ mph}, 10 \text{ mph}, and 15 \text{ mph}.
  2. Graph the function t\left(r\right).
  3. What happens to the function as the values of r \to 0?
  4. What happens to the function as the values of r \to \infty?
Inverse variation

A relationship in which the product of two variables is constant

The equation is given by

\displaystyle y=\dfrac{k}{x}
\bm{x}
First variable
\bm{y}
Second variable
\bm{k}
A constant of variation

As the value of one variable increases, the value of the other will decrease.

A reciprocal function models inverse variation and is a rational function that has a constant numerator. The parent reciprocal function is f\left(x\right) = \dfrac{1}{x}, and a graph of this function is shown below:

-4
-3
-2
-1
1
2
3
4
x
-4
-3
-2
-1
1
2
3
4
y

The function f\left(x\right) = \dfrac{1}{x} has two asymptotes: a vertical asymptote of x = 0 (the y-axis), and a horizontal asymptote of y = 0 (the x-axis).

Vertical asymptote

A vertical line that the graph of a function approaches as the function values head towards positive or negative infinity

A rational function with 3 branches graphed in a coordinate plane. The left most branch approaches the dashed vertical line x equals negative 3. The middle branch approaches the dashed vertical lines x equals negative 3 and x equals 1 and the right most branch approaches the dashed vertical line x equals 1 but the branches never reach the lines.

Notice that in the expression \dfrac{1}{x}, if x=0, the expression is undefined. Therefore, its domain is \left(-\infty, 0\right) \cup \left(0, \infty\right), which does not include 0 as the function is undefined at x=0.

Examine the end behavior of the reciprocal function as the domain approaches the undefined value of 0. Approaching from - \infty \to 0, f(x) approaches - \infty. Approaching from + \infty \to 0, f(x) approaches \infty.

Horizontal asymptote

A horizontal line that the graph of a function approaches as the domain values head towards positive or negative infinity

A rational function with two branches graphed on a coordinate plane. Each branch approaches a dashed horizontal line at y equals 2 but never reaches it.

Notice that there is no real value of x that could be substituted into the equation to create f(x)=0, because 1 divided by any number will never result in 0. So, its range is \left(-\infty, 0\right) \cup \left(0, \infty\right), which does not include 0 as the function values never reach the line y=0.

Similarly, when we examine end behavior of the reciprocal function as the domain values approach positive or negative infinity, we see that f\left(x\right) approaches zero. That is, as x approaches + \infty, f\left(x\right) approaches 0 from above and as x approaches -\infty, f\left(x\right) approaches 0 from below.

Asymptote

A line that a curve approaches as one or both of the variables in the equation of the curve approach infinity

A decreasing exponential function approaching but never touching a dashed horizontal line.

Reciprocal functions will have domain and range constraints due to the nature of dividing real numbers. Some real-world context problems may restrict the domain or range even further, based on practical considerations.

The parent reciprocal function has no x- or y-intercepts, due to its asymptotes. Reciprocal functions in general, however, can have intercepts when the function is translated vertically or horizontally.

Examples

Example 1

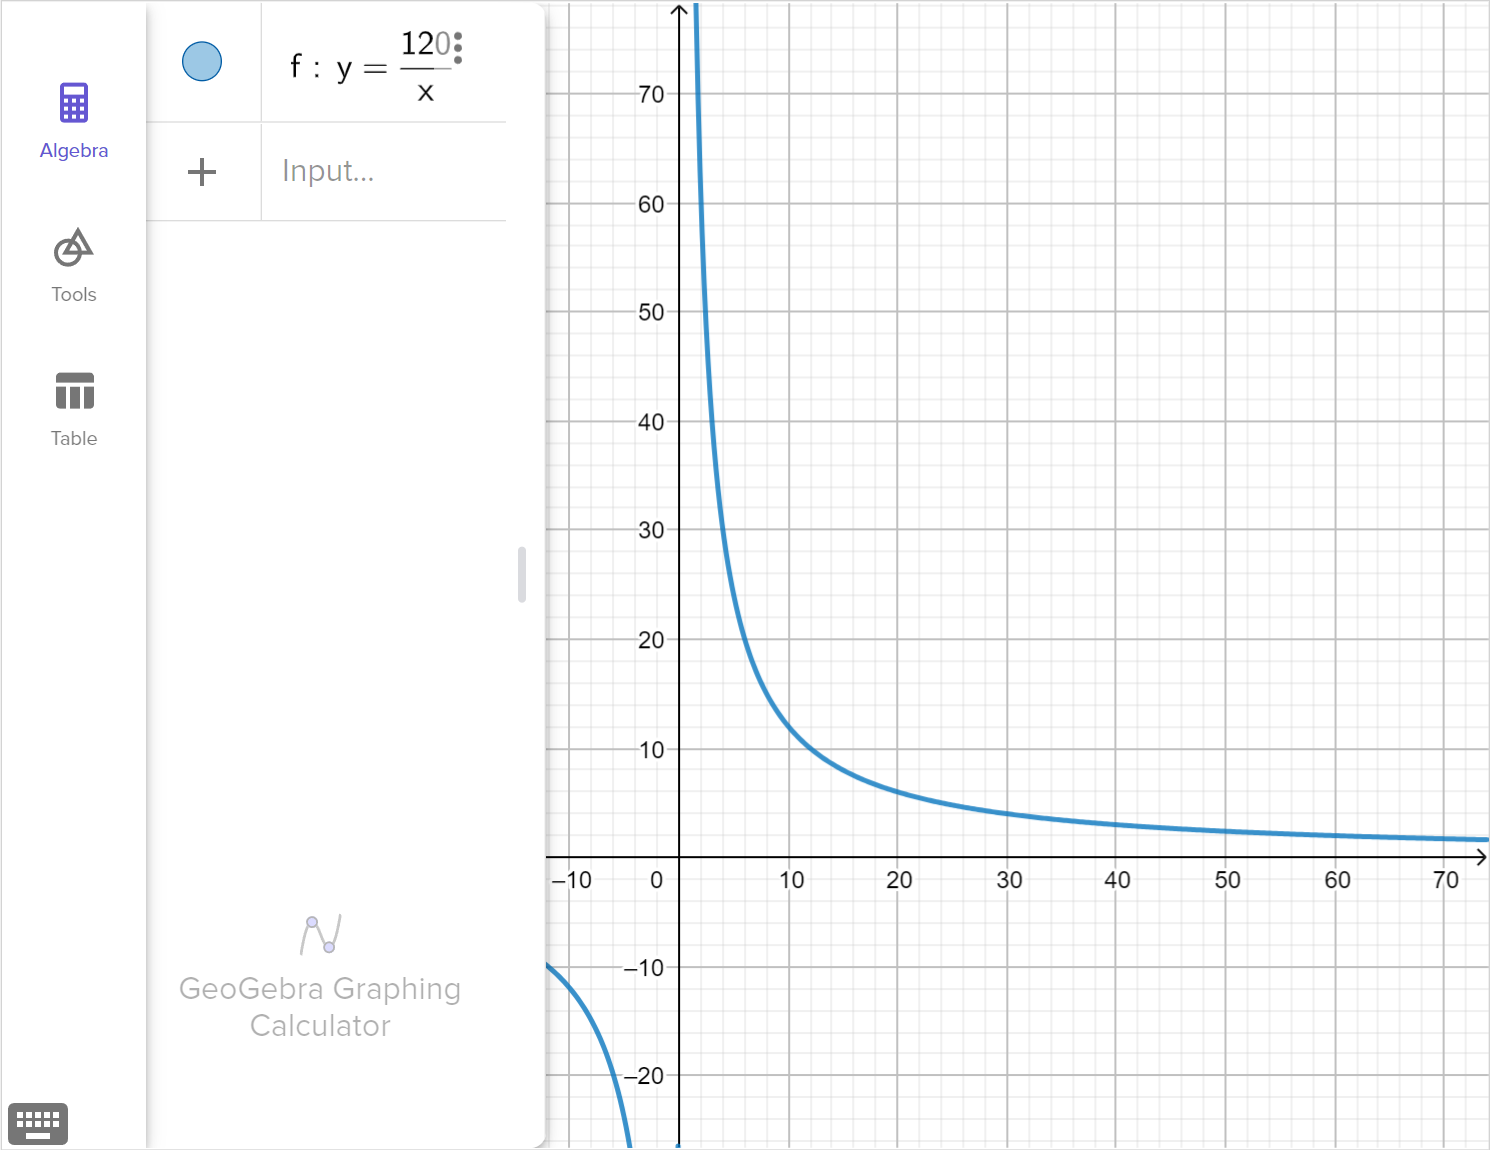
Consider the table of values.

x12345
y12060403024
a

Determine whether the table of values could represent an inverse variation between x and y.

Worked Solution
Create a strategy

We determine whether the two variable quantities can be represented by the equation for the inverse variation.

If the product of the two variables is always equal to the constant of variation, then the table of values represents an inverse variation.

Apply the idea

Note that the two quantities have inverse variation if they can be represented by the equation y=\dfrac{k}{x} where k is the constant of variation and the variable quantities are x and y.

Observe that y=\dfrac{k}{x} implies k=xy. So we multiply the values of x and y to find k.

If the product of the two variables is always equal to the constant of variation k, then the table of values represents an inverse variation.

Now,

\qquadIf x=1 and y=120, then xy=1 \cdot 120=120.

\qquadIf x=2 and y=60, then xy=2 \cdot 60=120.

\qquadIf x=3 and y=40, then xy=3 \cdot 40=120.

\qquadIf x=4 and y=30, then xy=4 \cdot 30=120.

\qquadIf x=5 and y=24, then xy=5 \cdot 24=120.

This means that k=120 since xy=120 for all (x,y).

Therefore, the table of values represents an inverse variation between x and y.

b

Write a function relating y and x, given the table of values.

Worked Solution
Create a strategy

We simply substitute the obtained value of the constant variation in part (a) to the equation for the inverse of variation.

Apply the idea

From part (a), we obtained the constant variation k=120.

Substituting k=120 to the equation y=\dfrac{k}{x}, we get y=\dfrac{120}{x}

Therefore, the table of values is represented by the equation y=\dfrac{120}{x}.

c

Describe the behavior of the function as x \to 0 from the right, and describe the behavior of the function as x \to \infty.

Worked Solution
Create a strategy

Use the table of values and graph the function using technology to determine the behavior of the function.

A screenshot of the GeoGebra graphing calculator showing the graph of y equals 120 over x. Speak to your teacher for more details.
Apply the idea

As x \to 0 from the right, the function goes to larger and larger values.

The rational function is undefined at 0 so 0 is excluded from the domain.

As x \to \infty, the function gets closer to 0.

Example 2

The relationship between the current, C, (in amperes) and resistance, R, (in ohms) in an electrical circuit is given by: C = \dfrac {200}{R}where the voltage provided to the circuit is 200\text{ V}.

An incomplete table of values for this relationship is given below.

R510202540
C8
a

Complete the table.

Worked Solution
Create a strategy

We substitute each value of R to the inverse variation equation C = \dfrac {200}{R} to find the value of C.

Apply the idea

Now,

\qquadIf R=5, then C= \dfrac {200}{5}=40.

\qquadIf R=10, then C= \dfrac {200}{10}=20.

\qquadIf R=20, then C= \dfrac {200}{20}=10.

\qquadIf R=25, then C= \dfrac {200}{25}=8.

\qquadIf R=40, then C= \dfrac {200}{40}=5.

Therefore, the complete table of values is:

R510202540
C40201085
b

Sketch the relationship between the current and resistance.

Worked Solution
Create a strategy

We assign the horizontal axis for variable R and the vertical axis for variable C.

We plot first the coordinates \left(R,C\right) on the coordinate plane. The points are: \left(5,40\right),\,\left(10,20\right),\,\left(20,10\right),\,\left(25,8\right) \text{ and }\left(40,5\right)

Then we graph the function C = \dfrac {200}{R}

Apply the idea
5
10
15
20
25
30
35
40
45
50
R
5
10
15
20
25
30
35
40
45
50
C
c

Specify any asymptotes and the restrictions on the domain of the function.

Worked Solution
Create a strategy

Use the graph of the relationship between the current and resistance to determine the asymptotes, then use the asymptotes, equation of the function, and context to determine the domain.

Apply the idea

We can see that the values of the function approach \infty as the value of R \to 0. There is a vertical asymptote at R=0.

The values of the function approach 0 as the value of R \to + \infty, and they will never reach 0. There is a horizontal asymptote at C=0.

At the vertical asymptote, R=0, the function is undefined since we cannot evaluate C=\dfrac{200}{0}, so we will exclude R=0 from the domain of the function.

Idea summary

A reciprocal function that models inverse variation is the rational function, f(x)=\dfrac{1}{x}.

The function f(x)=\dfrac{1}{x} has a horizontal asymptote at y=0 and a vertical asymptote at x=0, and the function has no intercepts.

Graphing rational functions

Exploration

Drag each slider to change the function.

Loading interactive...
  1. How does each slider change the parent function f \left( x \right) = \dfrac{1}{x}?

Transformations to the parent reciprocal function of inverse variation create the category of rational functions, given by the following equation:

\displaystyle f(x)= \dfrac{a}{x-h} + k, h \neq 0
\bm{a}
Stretch |a| >1 , shrink 0 < |a| < 1, reflection across the x-axis when a<0
\bm{h}
Horizontal translation
\bm{k}
Vertical translation, horizontal asymptote at y=k

Key features of rational functions may include increasing and decreasing intervals, domain and range, and can include horizontal and vertical asymptotes, and removable points of discontinuity.

Horizontal asymptotes are directly related to the end behavior of a rational function. When the degree of the numerator is less than or equal to the degree of the denominator, the rational function will have a horizontal asymptote.

Removable point of discontinuity

A point at which a function is not defined, but the graph of the function approaches that point from both sides. Sometimes called a "hole"

Vertical asymptotes and removable points of discontinuity occur at values of x where the function is undefined. Algebraically, these are related to the zeros of the polynomial in the denominator of the function:

  • A vertical asymptote will occur at x=n if x=n is a zero of the denominator, but is not a zero of the numerator or is a zero of lower multiplicity in the numerator
  • A removable point of discontinuity will occur at x=a if x=a is a zero of the denominator, and is a zero of the same or higher multiplicity in the numerator

Examples:

-2
-1
1
2
3
4
5
6
x
-4
-3
-2
-1
1
2
3
4
y
Vertical asymptote at x = 3
-4
-3
-2
-1
1
2
3
4
x
-4
-3
-2
-1
1
2
3
4
y
Vertical asymptote at x=-1 and removable point of discontinuity at x = 1

Examples

Example 3

Consider the function y = \dfrac{1}{x - 1}

x-100.51.523
y
a

Complete the table of values.

Worked Solution
Create a strategy

Substitute each of the values of x in the equation to solve for the values of y.

Apply the idea

Evaluating the expression \dfrac{1}{x - 1} at each value of x we get:

x-100.51.523
y-\dfrac{1}{2}-1-221\dfrac{1}{2}
b

Sketch a graph of the function.

Worked Solution
Create a strategy

We can plot the points from the table of values and use this to help draw the curve.

Based on the equation, we already know there will be a vertical asymptote at x=1, where the function is undefined. The function can also be written as y=\dfrac{1}{x-1} + 0, so the horizontal asymptote is at y=0.

We also don't have to worry about zeros in the numerator or multiplicity because the numerator is a constant without any variables, so there are no removable points of discontinuity.

Apply the idea
-4
-3
-2
-1
1
2
3
4
x
-4
-3
-2
-1
1
2
3
4
y
Reflect and check

The points in the table of values indicate that the vertical asymptote is between x = 0.5 and x=1.5. We can confirm that the asymptote is the line x = 1 by looking at the equation of the function: y = \dfrac{1}{x - 1} is undefined at x=1.

c

State the transformation of the parent function y = \dfrac{1}{x}.

Worked Solution
Apply the idea

Looking at the graph, and in particular the location of the vertical asymptote, we can see that the function has been translated 1 unit to the right.

Reflect and check

We can also use the equation of the function to identify the transformation of the function, comparing the equation to f(x)=\dfrac{a}{x-h} +k. We know there is no stretch, shrink, or reflection because the numerator remains the same as f(x)=\dfrac{1}{x}. The value of h=1, so we can state a horizontal translation 1 unit to the right, which we confirmed graphically. There is also no value of k, so there was no vertical translation.

Example 4

Consider the function y = \dfrac{1}{x} + 2

a

Sketch a graph of the function.

Worked Solution
Create a strategy

For the parent function f\left(x\right) = \dfrac{1}{x}, this function can be expressed as y = f\left(x\right) + 2, which is a vertical translation of 2 units upwards.

Apply the idea

The graph of f\left(x\right) = \dfrac{1}{x} is shown on the same coordinate plane:

-4
-3
-2
-1
1
2
3
4
x
-3
-2
-1
1
2
3
4
5
y
b

State the equations of the asymptotes of the function.

Worked Solution
Create a strategy

We know that this function is a vertical translation of the parent function by 2 units upwards. So the vertical asymptote hasn't changed, while the horizontal asymptote has translated 2 units upwards, which we can see in the graph.

Apply the idea

The vertical asymptote has the equation x = 0 and the horizontal asymptote has the equation y=2.

Reflect and check

We can use the equation to find that asymptotes as well. The horizontal asymptote occurs at y=k and since k=2, we can confirm that the horizontal asymptote occurs at y=2.

Since x=0 is a zero of the denominator, not the numerator, we can also confirm that the vertical asymptote occurs at x=0.

c

State the domain and range of the function, using interval notation.

Worked Solution
Create a strategy

We can see that the domain of this rational function will be all values of x except for the value at the vertical asymptote, where the function is undefined.

Similarly, the range of this function will be all values of y except for the value at the horizontal asymptote, which is the one value the function does not obtain.

Apply the idea

The domain of this function is "all real values of x except for 0," and the range is "all real values of y except for 2."

We can express this using interval notation as

  • Domain: \left(-\infty, 0\right) \cup \left(0, \infty\right)
  • Range: \left(-\infty, 2\right) \cup \left(2, \infty\right)
d

Identify the increasing interval(s) and decreasing interval(s) of the function.

Worked Solution
Apply the idea

It is clearest to see how the function changes by looking at its graph. In this case, we can see that both branches of the function are decreasing curves - to the left of the asymptote, the function decreases at an increasing rate, while to the right of the asymptote the function decreases at a decreasing rate.

So the function has two decreasing intervals, \left(-\infty, 0\right) and \left(0, \infty\right), and no increasing intervals.

Reflect and check

Note that even though the function is decreasing at every point in its domain, the domain is formed from two disconnected intervals (which are separated by the asymptote). So we cannot say that it has only one decreasing region.

Example 5

Consider the function shown in the graph:

-6
-5
-4
-3
-2
-1
1
2
x
-4
-3
-2
-1
1
2
3
4
y
a

Describe the transformation(s) used to get from the graph of y = \dfrac{1}{x} to the graph of this function.

Worked Solution
Create a strategy

We should check for each type of transformation: translations (vertical and/or horizontal), vertical stretch or compression, and reflection.

It may help to add the graph of y = \dfrac{1}{x} to the same coordinate plane:

-6
-5
-4
-3
-2
-1
1
2
x
-4
-3
-2
-1
1
2
3
4
y
Apply the idea

We can see that the curve lies in the upper-right and lower-left sections, relative to the asymptotes, which is the same as that of y = \dfrac{1}{x}, so no reflections have occurred.

The vertical asymptote of the graph is x=-3, which is 3 units to the left of the vertical asymptote of y = \dfrac{1}{x}. Their horizontal asymptotes are both the same (along the x-axis). So there has been a horizontal translation of 3 units to the left, and no vertical translation.

We can also see that the rate of change of the two graphs are different. Translating the point \left(1, 1\right) on the parent function to the left 3 units would result in the point \left(-2, 1\right), but the corresponding point on the graph is above it, at \left(-2, 2\right):

-6
-5
-4
-3
-2
-1
1
2
x
-4
-3
-2
-1
1
2
3
4
y

So there has been a vertical stretch by a factor of 2.

Reflect and check

Reflections and translations of rational functions are relatively straightforward to see by looking at the graphs and the asymptotes. Vertical stretches and compressions can be less obvious, however, so make sure to check multiple points to confirm the vertical stretch.

For instance, we can also check the point \left(-0.5, -2\right) on the parent function:

-6
-5
-4
-3
-2
-1
1
2
x
-4
-3
-2
-1
1
2
3
4
y

We can confirm that a horizontal translation of 3 units to the left followed by a vertical stretch by a factor of 2 also matches for this point.

b

Determine an equation for the function shown in the graph.

Worked Solution
Create a strategy

We can use the transformations that we described in part (a) and apply them to the function y = \dfrac{1}{x} to get an equation for the function shown.

Apply the idea

Starting with y = \dfrac{1}{x}, we can apply the transformations one at a time:

\displaystyle y\displaystyle =\displaystyle \dfrac{1}{x}Parent function
\displaystyle y\displaystyle =\displaystyle \dfrac{1}{x + 3}Horizontal translation of 3 units to the left
\displaystyle y\displaystyle =\displaystyle \dfrac{2}{x + 3}Vertical stretch by a factor of 2

So the equation of the function is y = \dfrac{2}{x + 3}.

Reflect and check

It is important to note that the order of transformations matters in some cases. For example, applying a vertical translation and then a reflection across the x-axis will be different to reflecting first and then applying the same vertical translation.

In this case, the transformations of a vertical stretch and a horizontal translation are independent and can be applied in any order.

Example 6

Consider the function f \left( x \right) = \dfrac{x+3}{x^2 + 7x + 12}

a

State the domain of the function.

Worked Solution
Create a strategy

As a rational function, the domain will be all real values of x except for those which make the denominator equal to 0. So we will set the denominator to be equal to 0 and solve for x.

Apply the idea
\displaystyle x^2 + 7x + 12\displaystyle =\displaystyle 0Set denominator equal to 0
\displaystyle \left(x + 3\right)\left(x + 4\right)\displaystyle =\displaystyle 0Factor the quadratic
\displaystyle x + 3 = 0,\quad x + 4\displaystyle =\displaystyle 0Set each factor equal to 0
\displaystyle x = -3,\quad x\displaystyle =\displaystyle -4Solve each equation for x

So the domain of the function will be \left(-\infty, -4\right) \cup \left(-4, -3\right) \cup \left(-3, \infty\right).

b

For each value of x not in the domain, determine whether there is a vertical asymptote or a removable point of discontinuity at that value.

Worked Solution
Create a strategy

If a factor in the denominator is not in the numerator, or is in the numerator but with a lower multiplicity, then there will be a vertical asymptote at the corresponding value of x.

If a factor is in the denominator and the numerator with the same or higher multiplicity, there will be a removable point of discontinuity instead.

So we also want to compare the factors of the numerator with the factors of the denominator.

Apply the idea
\displaystyle f\left(x\right)\displaystyle =\displaystyle \dfrac{x+3}{x^2 + 7x + 12}State the function
\displaystyle =\displaystyle \dfrac{x+3}{\left(x + 3\right)\left(x + 4\right)}Previous factoring of the denominator

We can see that the factor \left(x + 3\right) appears in both the numerator and denominator, while the factor \left(x + 4\right) only appears in the denominator.

As such, x = -3 will correspond to a removable point of discontinuity, while x = -4 will be the equation of a vertical asymptote.

Reflect and check

We can see why there is a removable point of discontinuity by analyzing the graph of the simplified form of f(x)= \dfrac{x+3}{x^2+7x+12}.

We know that \dfrac{\left (x+3 \right)}{\left (x+3 \right)}=1, so the function can be written as f(x)= \dfrac{x+3}{x^2+7x+12}= \dfrac{\left (x+3 \right)}{\left (x+3 \right) \left(x+4 \right)} = \dfrac{\left (x+3 \right)}{\left (x+3 \right)} \cdot \dfrac{1}{x+4} = 1 \cdot \dfrac{1}{x+4} = \dfrac{1}{x+4}

Consider the graph of f(x) = \dfrac{1}{x+4}:

-5
-4
-3
-2
-1
1
2
3
4
5
x
-5
-4
-3
-2
-1
1
2
3
4
5
y

The vertical asymptote at x=-4 remains, but in the original function, we know that x=-3 would lead to an undefined function as well, so we have to exclude both x=-3 and x=-4 from the domain, leaving a hole at x=-3.

Idea summary

Use the parent function to help determine transformations on f(x) = \dfrac{1}{x}:

\displaystyle f(x)= \dfrac{a}{x-h} + k, h \neq 0
\bm{a}
Stretch |a| >1 , shrink 0 < |a| < 1, reflection across the x-axis when a<0
\bm{h}
Horizontal translation
\bm{k}
Vertical translation, horizontal asymptote at y=k

Two other key features relevant to rational functions follow:

  • A vertical asymptote will occur at x=n if x=n is a zero of the denominator, but is not a zero of the numerator or is a zero of lower multiplicity in the numerator
  • A removable point of discontinuity will occur at x=a if x=a is a zero of the denominator, and is a zero of the same or higher multiplicity in the numerator

Outcomes

F.IF.B.5

Relate the domain of a function to its graph and, where applicable, to the quantitative relationship it describes.

F.IF.C.7.D (+)

Graph rational functions, identifying zeros and asymptotes when suitable factorizations are available, and showing end behavior.

F.BF.A.1.A

Determine an explicit expression, a recursive process, or steps for calculation from a context.

F.BF.A.1.B

Combine standard function types using arithmetic operations.

F.BF.B.3

Identify the effect on the graph of replacing f(x) by f(x) + k, kf(x), f(kx), and f(x + k) for specific values of k (both positive and negative); find the value of k given the graphs. Experiment with cases and illustrate an explanation of the effects on the graph using technology. Include recognizing even and odd functions from their graphs and algebraic expressions for them.

What is Mathspace

About Mathspace