topic badge

4.04 Modeling with polynomial functions (M)

Introduction

Throughout Algebra 1 and Geometry, we practiced modeling real-world situations with mathematics. In this lesson, we will dive into the first half of the modeling process, while also focusing on polynomial function models. When we model with mathematics, we work through the modeling cycle:

A modeling cycle. Starting with the phrase Identify the problem inside a circle. An arrow pointing to the right where the phrase Create a model is inside a rectangle. Next is an arrow pointing downward where the phrase Apply and analyze is inside a rectangle. Then, an arrow pointing to the right where the phrase Interpret results is inside a rectangle. Next is an arrow pointing upward where the phrase Verify the model is inside a triangle. Then, an arrow pointing to the right where the phrase Report findings is inside a circle. There is an arrow pointing to the left from the phrase Verify the model to Create a model.

Each time we model a real-world situation, we should:

  1. Identify the essential features of the problem

  2. Create a model using a diagram, graph, table, equation or expression, or statistical representation

  3. Analyze and use the model to find solutions

  4. Interpret the results in the context of the problem

  5. Verify that the model works as intended and improve the model as needed

  6. Report on our findings and the reasoning behind them

Identifying the problem

Situations that require modeling are often broad and complex. There may be multiple ways to solve the problems and multiple solutions to the problems. Before we can determine a path to a solution, we often need to clarify the problem that needs to be solved.

To clarify the problem, we need to do the following:

  • Restate the problem to clarify what the model intends to measure, predict, and/or solve

  • Identify questions that need to be considered prior to answering the given problem

  • List factors that will affect the outcome

  • Research information needed to answer the problem

  • State assumptions

By making assumptions, you are narrowing the focus of the problem you are trying to solve and thus, simplifying the process for solving the problem.

For example, if you are asked to identify the best noise-canceling headphones on the market today, you will need to make assumptions about what the word "best" refers to. You may make an assumption that "best" refers to the clarity of the sound produced and the level of outside noise that can be heard. Someone else may assume it refers to the value for money in terms of sound quality, price, durability, and/or battery life. Various assumptions lead to different but valid outcomes.

Examples

Example 1

Design a model for a roller coaster that contains at least 3 peaks.

a

Identify the important factors that need to be considered when answering this question.

Worked Solution
Create a strategy

Important factors affect the decision being made but they may not be explicitly stated in the problem. Our goal is to think of questions that need to be answered and identify these underlying aspects.

Apply the idea

Some important factors are:

  • What will the independent variable represent?

  • What will the dependent variable represent?

  • Will there be any restrictions on the variables?

  • How long are average roller coasters?

  • How tall are average roller coasters?

  • How long do average roller coasters last?

  • Can roller coasters begin and end at different heights?

Reflect and check

There may be other factors that are important, but you may not think of them until later in the modeling cycle. This list will be continuously revised, and the model may need to change too. That is normal and expected while working through the modeling cycle.

b

List assumptions that need to be made.

Worked Solution
Create a strategy

Because the question is broad and there are many factors that could affect our decision, we need to make assumptions to narrow our focus.

Apply the idea

A roller coaster's speed is variable throughout the ride. The ride moves slowly as it climbs a hill, and it moves quickly as it descends a hill. We do not have the skills or mechanics to calculate the speeds of the coaster, so we can assume that the plan for the roller coaster is focused more on its shape and design.

Reflect and check

Similar to the previous part, there may be other assumptions that need to be made later in the modeling cycle. It is important to continue writing down each assumption that is made throughout the process.

c

State a recommended plan for solving the problem, including any research that needs to be done to further clarify the problem.

Worked Solution
Create a strategy

To propose a plan, we need to address each of the important factors we previously listed by conducting research to clarify the factor or by creating an action item to account for the factor.

Apply the idea

A proposed plan for solving the problem may be as follows:

  • To focus on the shape and design of the coaster, the independent variable should represent length. We still need to decide on the unit of measure, so we can research how other coasters are measured.

  • The dependent variable will represent the height of the coaster. It will need the same unit of measure as the independent variable.

  • Since the variables are lengths, the domain is restricted to positive values. We still need to decide if the x-axis represents ground level or the height at which the riders board the coaster.

  • We need to research the average length and heights of roller coasters.

Reflect and check

Ideally, this plan will give us the information we need to create a good model for a roller coaster.

Idea summary

A modeling problem is often open-ended with many unknowns. Our job is to research and brainstorm the problem, determine how a model can solve the problem, and make necessary assumptions to support our model.

Creating and analyzing a model

A model may take on different forms. Models can be presented as equations, graphs, tables, diagrams, and maps. In most modeling questions, you need to determine which function type and which form of the model would best represent the situation and answer the question. The key factor is that the model conveys the information in a way that is accessible.

A variable is used to represent a quantity in our problem that can take on many values. A parameter is a known value that may remain constant in the model. When creating a model, we need to define the independent and dependent variables and state any restrictions on those variables.

After creating a model, it is important to analyze whether the model accurately represents the situation in context. If the model is not an accurate representation, then we need to adjust the model or decide on a new type of model.

Examples

Example 2

Jax threw a ball into the air as hard as he could. The path of the ball was modeled by J\left(x\right)=-16x^2+47x+5 where x represents the horizontal distance of the ball in feet and J\left(x\right) represents the vertical height in feet. Jax's friend Cade then took the ball and threw it twice as far as Jax did. Assume the boys are the same age and height with similar athletic abilities.

a

Create a model for the path of the ball thrown by Cade.

Worked Solution
Create a strategy

We need to decide what the phrase "twice as far" means. To throw it twice as high, Cade would have had to throw the ball much harder than Jax. But because the boys had the same athletic skill, this doesn't seem reasonable.

An assumption we can make is that "twice as far" refers to horizontal distance. This means we will need to find the rightmost x-intercept of Jax's throw, then create a model where the rightmost x-intercept is twice the distance.

Apply the idea

To determine the x-intercepts of Jax's throw, we can graph the function using technology.

1
2
3
\text{Distance in feet}
5
10
15
20
25
30
35
40
\text{Height in feet}

Since the rightmost x-intercept is x=3.04, we know Cade's ball must have landed at x=6.08. Assuming the left x-intercept is the same in both models, we can model Cade's throw by C\left(x\right)=a\left(x+0.103\right)\left(x-6.08\right)

Since both boys are the same height, we want the y-intercept to be \left(0,5\right). \begin{aligned}5&=a\left(0.103\right)\left(6.08\right)\\a&\approx -7.98\end{aligned}

Therefore, the function modeling Cade's throw would be C\left(x\right)=-7.98\left(x+0.103\right)\left(x-6.08\right). Now, we need to graph both functions on the same coordinate plane.

1
2
3
4
5
6
\text{Distance in feet}
10
20
30
40
50
60
70
\text{Height in feet}
b

Analyze the model you created to determine if it is a good fit for the situation. If it is a good fit, explain why. If it is not a good fit, adapt the model to better fit the situation.

Worked Solution
Create a strategy

To analyze the model, we need to look at the key features in context. We have already looked at the intercepts, so we now need to determine if the other values make sense in context.

Apply the idea

According to our model, Cade's ball does land twice as far as Jax's ball. However, Cade's ball also goes much higher than Jax's. That means that Cade would need to be much stronger than Jax in order to throw it that much higher. The information told us to assume the boys were the same size, so it would be highly unlikely that Cade was that much stronger than Jax.

We now need to make a new assumption and adjust the model. The new assumption is that Cade is not able to throw the ball much higher than Jax. The ball needs to reach a similar height as Jax's ball but travel twice as far horizontally.

Under this new assumption, Cade's throw can be modeled best by applying a horizontal stretch to the model of Jax's throw. Stretching the function for Jax's ball by a factor of 2 will make the ball reach the same height but travel twice as far. An algebraic model is:

\displaystyle J\left(x\right)\displaystyle =\displaystyle -16x^2+47x+5Function modeling Jax's throw
\displaystyle C\left(x\right)\displaystyle =\displaystyle J\left(\frac{x}{2}\right)Horizontal stretch by a factor of 2
\displaystyle =\displaystyle -16\left(\frac{x}{2}\right)^2+47\left(\frac{x}{2}\right)+5Apply the horizontal stretch
\displaystyle =\displaystyle -4x^2+\frac{47}{2}x+5Evaluate the exponents and multiplication

Graphing J\left(x\right) and C\left(x\right) helps us compare the paths of both throws and confirm that Cade's ball travels twice the distance of Jax's, without going any higher.

1
2
3
4
5
6
\text{Distance in feet}
5
10
15
20
25
30
35
40
\text{Height in feet}
Reflect and check

Creating the model and analyzing the model are typically done at the same time in real-world situations. When creating a model, it is important that we analyze whether it make sense in the given context without being prompted. If it doesn't, we must go back and adjust it.

Adjusting the model or trying another route is common when modeling real-world situations as it can be difficult to get something right the first time around.

c

Explain how Cade was able to throw the ball twice as far.

Worked Solution
Create a strategy

In the previous part, we assumed that the boys were of similar strength since they were the same size. To get an idea of how Cade managed to throw the ball further than Jax, we can analyze the graph of both throws.

Apply the idea
1
2
3
4
5
6
\text{Distance in feet}
5
10
15
20
25
30
35
40
\text{Height in feet}

From the graph, we can see that the boys threw the ball from the same height and the ball reached the same height in both throws. The difference between the throws is the angle of elevation. Jax threw the ball straight into the air, so his throw has a steeper incline. The angle of elevation of Cade's ball is smaller, so the ball traveled further.

Reflect and check

Other assumptions about the height could also make sense in this context. For example, someone may have assumed that Cade's ball would travel twice as far but only reach 75\% the height of Jax's ball. This assumption could also have created a valid model for the situation.

Example 3

Kala wants to build a fruit and vegetable garden in her family's backyard. To support her ambitions, her family bought 300\text{ ft} of fencing for her to use. Kala wants to separate the fruit from the vegetables, so her plan is to build an enclosure that is separated down the middle by a row of fence.

Kala plans to use all the available fencing to create her garden. She is debating between a circular and rectangular garden.

a

Create a model to represent the perimeter and area for each garden type. Define your variables and discuss any constraints.

Worked Solution
Create a strategy

To help us visualize this situation, a diagram would be a good model to start with. The diagram can help us create equation models which will then help us solve the question in part (b).

Apply the idea

Because Kala wants to separate the fruit from the vegetables with a row of fencing, we need to include that part of the fence in our calculations. The perimeter will be the fence around the outside and the fence on the inside.

A rectangular fence with a length of y and a width of x. An inside fence of length x divides the rectangle into two.

Let x represent the width of the rectangle which is the same length as the fence in the middle. Let y represent the length. Then, the equation for the perimeter is3x+2y=300 The area function is A\left(x,y\right)=xy

If we solve the perimeter equation for y, we get \begin{aligned}3x+2y&=300\\2y&=300-3x\\y&=150-1.5x\end{aligned} If we substitute 150-1.5x for y in the area formula, we can get a better understanding of the function.\begin{aligned}A\left(x\right)&=x\left(150-1.5x\right)\\&=150x-1.5x^2\end{aligned}

Because x represents a length, we know it must be a positive value. We can determine the upper limit of x by finding when either function is greater than zero. \begin{aligned}150-1.5x&>0\\150&>1.5x\\100&>x\end{aligned} This means 0<x<100.

For the circle, the perimeter can also represent the outside of the circle (the circumference) plus the fencing that goes down the middle.

A circle with its diameter labeled d equals 2 r.

Let r represent the radius of the circle. Then the perimeter equation is 2\pi r+2r=300. Since this is in one variable, we can solve for r.

\displaystyle 2\pi r +2r\displaystyle =\displaystyle 300Equation for perimeter
\displaystyle \pi r+r\displaystyle =\displaystyle 150Divide both sides by 2
\displaystyle r\left(\pi +1\right)\displaystyle =\displaystyle 150Factor out r
\displaystyle r\displaystyle =\displaystyle \frac{150}{\pi +1}Divide both sides by \pi +1
\displaystyle r\displaystyle \approx\displaystyle 36.218Evaluate with a calculator

The area of the circle can be represented by A=\pi r^2. Since we know the radius, we can substitute and solve this to find the size of the circle that is possible with the amount of fencing available.

\displaystyle A\displaystyle =\displaystyle \pi r^2Equation for area
\displaystyle =\displaystyle \pi \left(36.218\right)^2Substitute r=36.218
\displaystyle \approx\displaystyle 4120.964Evaluate with a calculator

With 300\text{ ft} of fencing, a circle with an area of 4\,120.964\text{ ft}^2 can be constructed.

b

Analyze your models to determine which type of garden Kala should make. Include the dimensions of the garden. Give mathematical and contextual arguments to defend your choice.

Worked Solution
Create a strategy

To answer this question, we will need to make an assumption about what key features Kala and her family might prefer. A rectangular shape is typical and may be easier to create, or may better fit a plot of land. A circle may waste space, or it may be difficult to plant seeds around the edge of the circle. But maybe Kala isn't concerned about the shape. Maybe she simply wants the shape that has the largest area.

Apply the idea

In part (a), we found the area of a circular garden with the amount of fencing available is about 4\,121\text{ ft}^2. Graphing the area function of the rectangular garden can help us make decisions about selecting the shape Kala should choose for the garden.

10
20
30
40
50
60
70
80
90
\text{Width in feet}
500
1000
1500
2000
2500
3000
3500
4000
\text{Area in ft}^2

Finding the vertex algebraically or looking at the graph, we find that the maximum area of a rectangular enclosure is 3\,750\text{ ft}^2. So, the area of the rectangular garden will always be less than the area of the circular garden.

Let's assume that Kala prefers gardening in rows. Although the circular garden has more space, the edges of the circle might end up wasting space which would make the area similar to the area of the rectangle since there is only a difference of a few hundred square feet.

With these factors in mind, Kala should build a rectangular garden. Assuming she wants to maximize the area, we can use the x-value of the vertex of the parabola to find the width of the garden. The width of the garden would be 50\text{ ft}, and the length of the garden would be:

\displaystyle 3x+2y\displaystyle =\displaystyle 300Perimeter equation
\displaystyle 3\left(50\right)+2y\displaystyle =\displaystyle 300Substitute the width, x=50
\displaystyle 150+2y\displaystyle =\displaystyle 300Evaluate the multiplication
\displaystyle 2y\displaystyle =\displaystyle 150Subtract 150 from both sides
\displaystyle y\displaystyle =\displaystyle 75Divide both sides by 2

Therefore, the dimensions of the rectangular garden would be 50\text{ ft} by 75\text{ ft}.

Reflect and check

Our original diagram and equation models represented the situation accurately. But when we analyzed our models to choose a garden shape, we realized that a graph was also helpful to visualize the situation. Sometimes one type of model alone is not sufficient to find a solution. Multiple models were used to make sense of this problem, including diagrams, function equations, and graphs.

Example 4

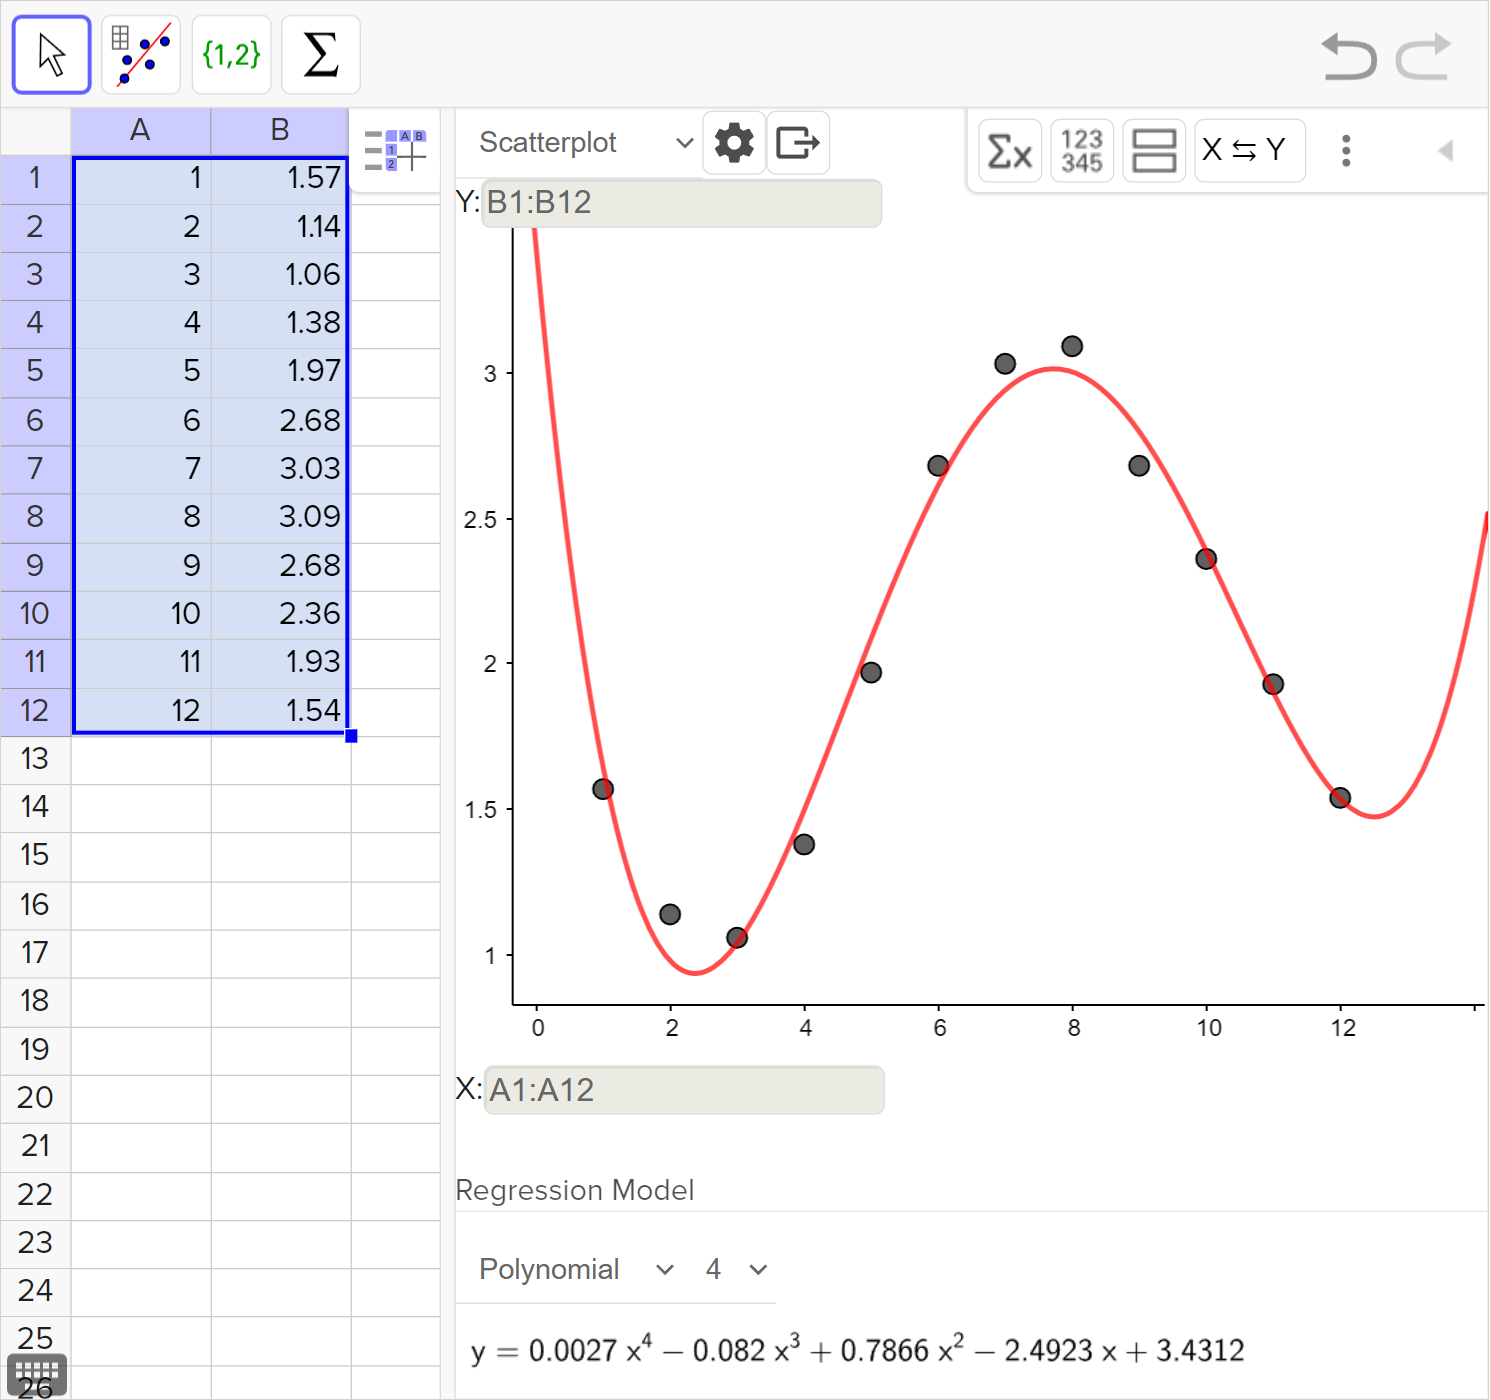
A city in Russia recorded the amount of rainfall in inches from March to December of a particular year. The results are shown in the table below.

Month\text{Mar}\text{Apr}\text{May}\text{June}\text{July}\text{Aug}\text{Sept}\text{Oct}\text{Nov}\text{Dec}
Rainfall1.061.381.972.683.033.092.682.361.931.54
a

Explain which type of regression model you think best fits the data.

Worked Solution
Create a strategy

Plotting the data values will give insight about which type of function might best model the data. To plot the values, we need to define the variables. Let x represent the number of the month where March is month 1, April is month 2, etc.

1
2
3
4
5
6
7
8
9
10
\text{Month}
1
2
3
\text{Rainfall in inches}

This data could be represented by a few different polynomials, so it is important to defend our choice. Note that the curve does not need to pass through every point, but the model would be more accurate if it included as many points as possible.

Apply the idea

The data begins increasing, then decreases around x=6. Therefore, a quadratic function appears to be a good function type for this data.

Reflect and check

Another student may have argued that a cubic function would fit this best because the point at x=1 appears to be a turning point. Since there is also a turning point around x=6, this must be at least a cubic function.

Someone else may have said a quartic would be best because the data on the right side appears to decrease at a decreasing speed as it would just before a third turning point. Analyzing the data in this way helps us decide which type of model to start with when using technology to find a regression model.

b

Two previously collected data points were accidentally overlooked when the table was created. The added data points are: \begin{aligned}\text{Jan }1.57\\\text{Feb }1.14\end{aligned} Explain how this affects the type of function you would choose to fit the data.

Worked Solution
Create a strategy

We had previously defined the independent variable as the number of the month beginning from March. Now, the two months before March have been added, so we need to redefine x. Let x represent the number of the month where January is month 1, February is month 2, March is month 3, etc.

Now, let's re-plot the data values to gain insight on which type of function may be used to model the data.

1
2
3
4
5
6
7
8
9
10
11
12
\text{Month}
1
2
3
\text{Rainfall in inches}
Apply the idea

The added data do affect the type of function we chose in part (a). It is clear that this data now has 2 turning points, so it now appears that a cubic function would fit the data best.

Reflect and check

This answer will depend on what type of model was originally chosen in part (a). If a cubic function was already chosen in part (a), then these added data might not affect the decision.

c

Create a regression model that best fits all the data from the full calendar year. Justify the reasoning for your choice of model.

Worked Solution
Create a strategy

To create a regression model, we can use a technological tool. To use the tool, we need to enter the given data into a table, then find the polynomial regression of the desired degree.

Apply the idea

One technology tool we can use to calculate the regression equation is the statistics calculator in GeoGebra.

  1. Enter the x- and y-values in two separate columns, then highlight the data and select Two Variable Regression Analysis:

  2. Choose Polynomial under the Regression Model drop down menu, then choose 3 under the next drop down menu to find the cubic of best fit:

The cubic curve of best fit is okay, but there are several points above and below the curve. We can use Geogebra to try to find a higher degree polynomial that fits the data better. Using the drop down menu on the right, we will choose 4 to examine the quartic curve of best fit.

This curve fits the data much better than the cubic because there are more points on or near the curve.

Therefore, a regression model that can be used to fit the data is f\left(x\right)=0.0027x^4-0.082x^3+0.7866x^2-2.4923x+3.4312.

Reflect and check

For this data set, as the degree of the polynomial increases, the curve seems to more accurately model the given data. A 5th degree polynomial would be an even better match.

When finding the best fit for data, statisticians do not just estimate the curve of best fit based on a visual inspection of the graph. Instead, they make other mathematical calculations about their models to quantify how closely the data fits the regression. Statisticians and scientists would also consider features of the both the graph of a function and the context that might lead to choosing a particular model.

d

The city council wants a report about the rainfall over the course of the year. Explain to the council what information the model created in part (c) can provide. Include any limitations of the model.

Worked Solution
Apply the idea

The model can be used to fairly accurately evaluate the amount of rainfall that fell in the weeks between data collection points. We could calculate the rainfall at 4.25 months to find out how much rain there was the first week of April, for example.

However, the polynomial function model will not be useful to extend beyond December because a polynomial function will ultimately have end behavior that goes to positive or negative infinity. In other words, the model has domain restrictions from January to December of that particular year. The rainfall for the next year is more likely to repeat a similar pattern to the current year.

Reflect and check

Because this data is likely to increase and decrease year after year, a different type of function may be a better fit for modeling multiple years of rainfall. We will learn about other functions that may end up being a better fit for this type of data later in Algebra 2.

Idea summary

Models can be presented as equations, graphs, tables, diagrams, and maps. In most modeling problems involving functional relationships, you need to determine which function type and which form of the model would best represent the situation and answer the question.

When creating a model, we must always define the variables. After the model is created, we need to analyze the model in context. If the model does not make sense in context, does not fit the situation well, or does not give a complete picture, we can create a new, revised, or additional model.

Outcomes

A.SSE.A.1

Interpret expressions that represent a quantity in terms of its context.

A.SSE.A.1.A

Interpret parts of an expression, such as terms, factors, and coefficients.

A.SSE.A.1.B

Interpret complicated expressions by viewing one or more of their parts as a single entity.

A.REI.D.11

Explain why the x-coordinates of the points where the graphs of the equations y = f(x) and y = g(x) intersect are the solutions of the equation f(x) = g(x); find the solutions approximately.

F.BF.A.1

Write a function that describes a relationship between two quantities.

What is Mathspace

About Mathspace