
Investigation: Interpretation of data with awareness of issues
In this discussion, we consider data that is generated by taking measurements on a set of subjects that have been given various amounts of some treatment.
For example, an agricultural scientist might try applying different amounts of a new fertilizer to separate plots within a wheat crop. The treatment is the fertilizer and the subject is the wheat. We also may say that the amount of fertilizer is the independent variable and the size of the wheat is the dependent variable. If there are only random differences in the amount of growth measured in the separate plots of wheat, then the scientist might conclude that varying the amount of fertilizer does not explain variations in the growth in the wheat plots.

The words treatment and response are used both for experimental situations where the treatment can be deliberately varied and also for observational studies where naturally occurring variations in one quantity might be found to be related to variations in another.
Often, what is called a treatment might have to be just a naturally occurring variation, like a person's weight. In medical research, for example, it would be unethical to deliberately manipulate a patient's weight in order to see what effect this had on his or her heart rate. But, a large number of subjects having various weights could be observed and their heart rates measured, and the different weights would be considered as treatments.
So, we consider the relation between a treatment (independent) variable and a response (dependent) variable. The data will consist of pairs of numbers (a,b) where the first number a is the level of a treatment for one of the subjects and the second number b is the observed response measurement.
After collecting the data, the pairs of numbers can be displayed in a scatter plot.
Example 1
For the purposes of illustration, it does not matter what the experiment was. For the moment, we are only interested in the data. Suppose the treatment levels were 1, 2, 3, 4, 5 and there were three trials at each level. That is, three subjects were observed at each treatment level so that 15 data points were collected in all.
| Treatment Level | 1 | 1 | 1 | 2 | 2 | 2 | 3 | 3 | 3 |
| Response | 6 | 5.5 | 6.5 | 9 | 11 | 10 | 12 | 16 | 14 |
| Treatment Level | 4 | 4 | 4 | 5 | 5 | 5 |
| Response | 18.5 | 17.5 | 19 | 19 | 21 | 26 |
By convention, the treatment variable is measured along the horizontal axis and the corresponding responses are on the vertical axis.
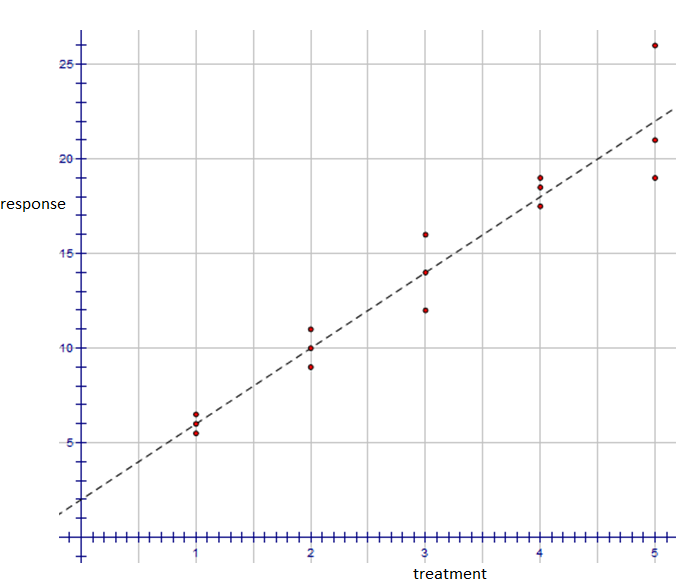
In this example, it is clear from the plot that the response is related to the treatment level. The data points appear to be clustered around a line.
The line is called a regression line. It is the line that comes closest to all of the data points and is often called a line of best fit. The regression line predicts approximately what the response will be in a future experiment given some treatment level. The researcher's next step would be to work out the formula for the regression line.
Data points are not always so clearly clustered around a regression line. There will be a line of best fit in every case but it may not be a good predictor of future results when the observed responses are scattered with no clear trend or pattern.
Example 2
The following pairs of measurements were obtained from an observational study.
(12.5, 24), (14, 23.5), (14.4, 24.5), (15.3, 21), (15.7, 22.5), (16.1, 24.5), (16.5, 25.5), (17.2, 26), (18, 25.9), (18.5, 26.5), (19.5, 21).
The following scatter plot displays this data.
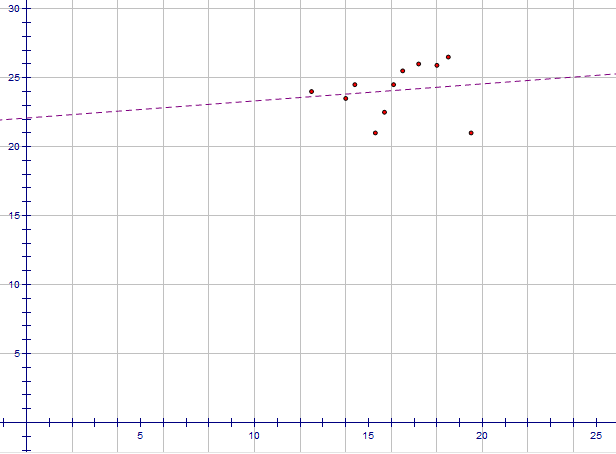
It is still possible to insert a line of best fit. There are technical methods for doing this. However, the plot suggests that the response changes very little and unpredictably with changes in the treatment level.
Activity
The process of collecting and analyzing data begins with a hypothesis. An experiment or an observational study is then carried out carefully to test the hypothesis.
To complete this investigation, you should propose your own hypothesis and design a study to test it. For example, suppose you wish to test the theory that a person's hand span has an effect on their typing speed when composing text messages. The following is only a suggestion. Try to come up with your own.
Procedure
- Decide on the hypothesis you wish to test
- Review the information on bias and ethics below
- Choose the population about which you want to draw the conclusion
- Select your experimental subjects - there may be some bias if you choose a convenient sample
- Carry out the appropriate measurements and collect in a table
- Display the data as a scatter plot using Excel or Google Sheets
- Insert a regression or trend line (optional)
- Confirm or refute your hypothesis
Bias
We want to include a variety of people, so we should not include only expert texters in the study as this could introduce a bias. Any conclusions would only relate to people who fell into the category of expert texters and not to the general population. Instead, subjects for the experiment should be randomly selected so that they do reflect the abilities of the population.
It may be that certain groups could be expected to have differing texting abilities for cultural or generational reasons. There could be people with no experience with cellphones, for example. These people would introduce a factor to the experiment that could confuse the results.
The experimenter should be aware that the conclusions reached can only apply to the actual population from which the subjects were selected. The experiment can say nothing definite about classes of people who were not adequately represented in the data.
Ethics
Some subjects might be sensitive about their hand span or about their texting ability. You should make sure individual subjects cannot be identified in the data. Usually, the names of subjects in an experiment or survey are kept separately from the measurements they provide.
It may be that a person you selected to be a subject in your experiment has an objection to having their hand span measured. Some may be unable to participate for medical reasons.
In such a case, you would need to replace the subject with someone else selected randomly from the population you are testing.