
2.04 Review: Graphs and characteristics of quadratic functions
Identifying key features
In Algebra I, we explored a few key features of quadratic functions. In this lesson, we are going to continue to distribute our understanding of quadratic functions.
A quadratic function is a nonlinear function that can be written in general form:
$y=ax^2+bx+c$y=ax2+bx+c, where $a$a$\ne$≠$0$0 and vertex occurs at $x=\frac{-b}{2a}$x=−b2a
and can be written in vertex form (or standard form):
$y=a\left(x-h\right)^2+k$y=a(x−h)2+k, where $a$a$\ne$≠$0$0 and vertex is $\left(h,k\right)$(h,k)
The U-shaped graph of a quadratic function is called a parabola.
The quadratic function produces a continuous function.
Transformational graphing
A parent function is the most basic function of a family of functions. It preserves the shape of the entire family. The graph below models the function $f\left(x\right)=x^2$f(x)=x2, which is most basic quadratic function.

- The $x$x- and $y$y-intercepts are at the origin $\left(0,0\right)$(0,0).
- The extrema is an absolute minimum of $0$0.
- The domain of the function is all real numbers, $\left(-\infty,\infty\right)$(−∞,∞)
- The range of the function is all real numbers greater than $0$0, i.e. $\left[0,\infty\right)$[0,∞)
- The vertex, or turning point, is at the origin $\left(0,0\right)$(0,0). The axis of symmetry is the vertical line $x=0$x=0.
Translation
When a graph is shifted either horizontally or vertically, it is called a translation.
Horizontally: $g(x)=f(x-h)$g(x)=f(x−h) is $f\left(x\right)$f(x) translated $h$h units right when $h>0$h>0 or $h$h units left when $h<0$h<0
Vertically: $g\left(x\right)=f\left(x\right)+k$g(x)=f(x)+k is $f\left(x\right)$f(x) translated $k$k units up when $k>0$k>0 or $k$k units down when $k<0$k<0
Exploration
Let's say we want to move our parent graph of $f\left(x\right)=x^2$f(x)=x2 to the left two units. To do this, we subtract negative two from the $x$x-value inside parentheses: $f\left(x\right)=\left(x-\left(-2\right)\right)^2$f(x)=(x−(−2))2, which is the same as $f\left(x\right)=\left(x+2\right)^2$f(x)=(x+2)2. So shifts to the right are represented by subtracting a number inside the parentheses, while shifts to the left are represented by adding a number inside the parentheses.

What is the impact of the shift on the key features of the graph?
- The $x$x-intercept is shifted to $\left(-2,0\right)$(−2,0). The $y$y-intercept has also moved, and is at the point $\left(0,4\right)$(0,4).
- The extrema is an absolute minimum of $0$0.
- The domain of the function is all real numbers, $\left(-\infty,\infty\right)$(−∞,∞)
- The range of the function is all real numbers greater than $0$0, i.e. $\left[0,\infty\right)$[0,∞)
- The vertex, or turning point, is at the $x$x-intercept of $\left(-2,0\right)$(−2,0). The axis of symmetry is the vertical line $x=-2$x=−2.
Now, let's explore the what happens when we shift the parent function up one unit. We will add one to the parent function, $x^2$x2: $f\left(x\right)=x^2+5$f(x)=x2+5. Vertical shifts up are represented by adding a number outside of the parentheses, while vertical shifts down are represented by subtracting a number outside of the parentheses.

What is the impact of the shift on the key features of the graph?
- The function no longer has any $x$x-intercepts. The y-intercept has been shifted to the point $\left(0,1\right)$(0,1).
- The extrema is an absolute minimum of $1$1.
- The domain of the function is all real numbers, $\left(-\infty,\infty\right)$(−∞,∞)
- The range of the function is all real numbers greater than or equal to $1$1, i.e. $\left[1,\infty\right)$[1,∞)
- The vertex, or turning point, is at the $y$y-intercept $\left(0,1\right)$(0,1). The axis of symmetry is the vertical line $x=0$x=0.
Dilation and reflection
Dilation has the effect of stretching or compressing the parent function graph while the reflection flips the graph over the $x$x-axis.
Dilation: $g\left(x\right)=af\left(x\right)$g(x)=af(x) if $a>1$a>1 stretches away from $x$x-axis; if $0
Reflection: $g\left(x\right)=-f\left(x\right)$g(x)=−f(x) reflected over the $x$x-axis
Note: When sketching the graph of a reflection, the ordered pair changes from $\left(x,y\right)$(x,y) $\longrightarrow$→ $\left(x,-y\right)$(x,−y) for a reflection in the $x$x-axis.
Exploration
When given the parent function, $y=x^2$y=x2, is multiplied by a real number greater than $0$0, the parabola changes its shape. It remains a U-shape; however the U-shape becomes either compressed or stretched. The graph below shows the parent function, $y=x^2$y=x2, and two other functions.
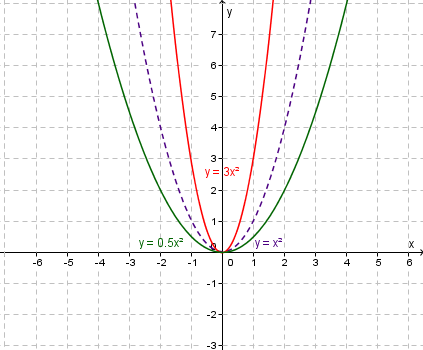
What do we notice about the change in shape of the parabola:
- The parabola $y=3x^2$y=3x2 is steeper (compressed) than its parent function.
- The $y$y-value of each point on $y=3x^2$y=3x2 parabola is three times the $y$y-value of the point on its parent function with the same $x$x-value. Hence, the graph has been compressed by a factor of $3$3
- The parabola $y=0.5x^2$y=0.5x2 is not as steep as its parent function.
- The $y$y-value of each point on $y=0.5x^2$y=0.5x2 parabola is half the y-value of the point on its parent function with the same $x$x-value. Hence, the graph has been stretched by a factor of $0.5$0.5
- The following is unchanged from the parent function:
-
The $x$x- and $y$y-intercepts are at the origin $\left(0,0\right)$(0,0).
-
The extrema is an absolute minimum of $0$0.
-
The domain of the function is all real numbers, $\left(-\infty,\infty\right)$(−∞,∞)
-
The range of the function is all real numbers greater than $0$0, $\left[0,\infty\right)$[0,∞)
-
The vertex, or turning point, is at the origin $\left(0,0\right)$(0,0). The axis of symmetry is the vertical line $x=0$x=0
-
Now, what happens when we multiply the parent parent function by a negative $1$1?
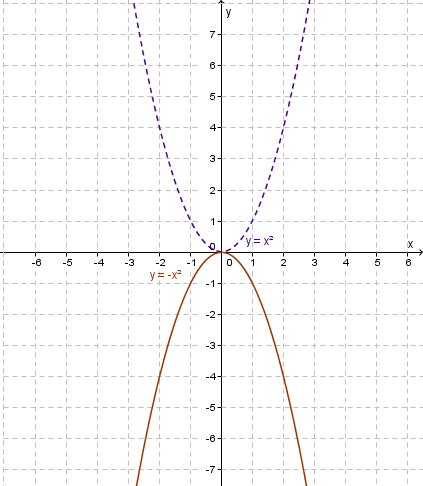
What do we notice about the change in shape of the parabola:
- The parabola $y=-x^2$y=−x2 maintains the same shape as its parent function.
- The ordered pairs on $y=3x^2$y=3x2 parabola are the opposite of those on its parent function: $\left(x,y\right)$(x,y) $\longrightarrow$→$\left(-x,-y\right)$(−x,−y). Hence, the graph has been flipped across the x-axis
- The parabola does not have an absolute minimum. It does have an absolute maximum at $0$0
- The range of the graph $y=-x^2$y=−x2 is all real numbers less than or equal to $0$0, $\left(-\infty,0\right]$(−∞,0]
- The following is unchanged from the parent function:
- The $x$x- and $y$y-intercepts are at the origin $\left(0,0\right)$(0,0).
- The domain of the function is all real numbers, $\left(-\infty,\infty\right)$(−∞,∞)
- The vertex, or turning point, is at the origin $\left(0,0\right)$(0,0). The axis of symmetry is the vertical line $x=0$x=0.
Increasing and decreasing intervals
A function can be described as increasing, decreasing, or constant over a specified interval or the entire domain. Since a parabola is U-shaped, the graph has specific intervals where it increases and decreases. Because the vertex is the greatest or least point on a parabola, its y-coordinate is the maximum value or minimum value of the function. The vertex of a parabola lies on its line of symmetry. So, the graph of the function is increasing on one side of the line of symmetry and decreasing on the other side.

Notice, that the intervals do not include $0$0. The vertex is the point where the graph changes direction; therefore this point cannot be increasing or decreasing.
Practice questions
question 1
Consider the graph of the function $y=f\left(x\right)$y=f(x) and answer the following questions.
What is the absolute minimum of the graph?
Hence determine the range of the function.
$y\ge\editable{}$y≥
Over what interval of the domain is the function increasing?
$x>\editable{}$x>
question 2
This is a graph of $y=x^2$y=x2.
How do we shift the graph of $y=x^2$y=x2 to get the graph of $y=\left(x-2\right)^2$y=(x−2)2?
Move the graph downwards by $2$2 units.
AMove the graph to the right by $2$2 units.
BMove the graph to the left by $2$2 units.
CMove the graph upwards by $2$2 units.
DHence plot $y=\left(x-2\right)^2$y=(x−2)2 on the same graph as $y=x^2$y=x2.
Loading Graph...
question 3
Consider the equation $y=x^2+5$y=x2+5.
Complete the set of solutions for the given equation.
$A$A$($($-3$−3, $\editable{}$$)$), $B$B$($($-2$−2, $\editable{}$$)$), $C$C$($($-1$−1, $\editable{}$$)$), $D$D$($($\editable{}$, $5$5$)$), $E$E$($($1$1, $\editable{}$$)$), $F$F$($($2$2, $\editable{}$$)$), $G$G$($($3$3, $\editable{}$$)$)
Plot the points $C$C, $D$D and $E$E on the coordinate axes.
Loading Graph...Plot the curve that results from the entire set of solutions for the equation being graphed.
Loading Graph...