Choice of Graph for Data (Investigation)
Data is important. More and more, big decisions are being made based on data, from doctors using genetic analysis to give people the right medicine for them to Facebook deciding what to show on your news feed. Indeed, the notion of making decisions based on huge data-sets, called "Big Data", is one of the defining technologies of the 21st century.
But there's no point in collecting all this data if you don't have a good way of looking at it. The way in which you present data can make all the difference in actually allowing people to draw conclusions from it.
Let's get you started on the basics of data visualisation, starting with the basics: what graph to use for what kind of data.
What Do You Want To Show?
With the exception of some (rather boring) scientific literature, graphs are usually used for a specific reason. Therefore, your choice of graph should reflect what you want to show.
You Want To Compare Things
If you want to compare things, a column graph is a good first choice. It is simple to understand, and gives a good visual sense of how different things are. Here is an example:
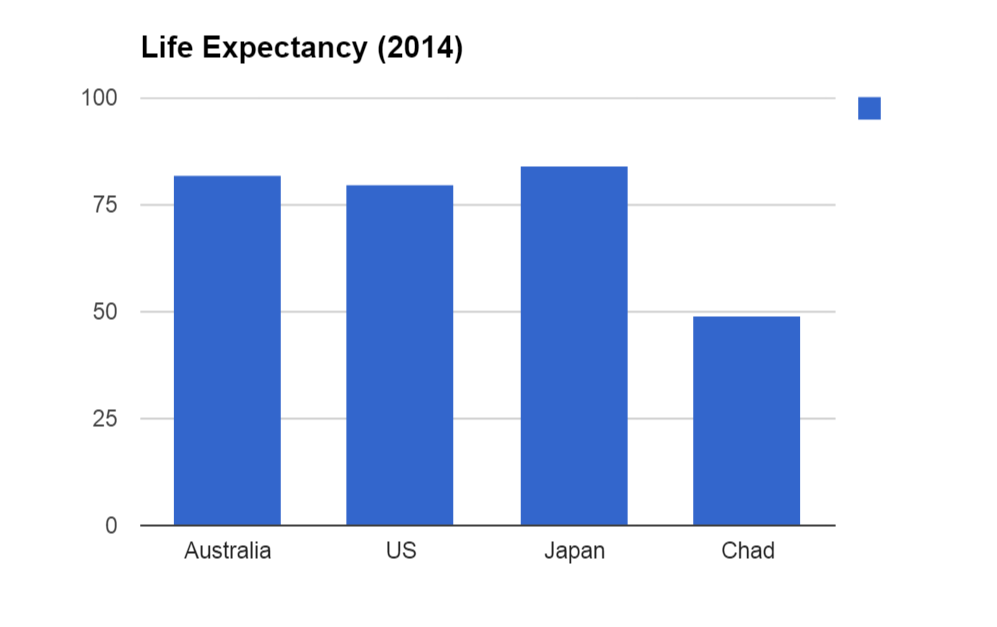
The reason that column graphs like this are so easy to understand is that you can easily compare the sizes between the columns. Here we can see that the difference between Australia, the US and Japan is really quite minor compared with the huge difference with the world's lowest life expectancy in Chad.
While we're on the topic of column graphs, let's also discuss one of the common "mistakes" in making graphs:
Mistake #1: Avoid starting your axis above zero, as this can make your graphs misleading.
Why? You can read all about it here.
Mistake #2: Never use 3D column graphs, as they make it hard to understand the data.
Source: http://ljhsdcruze.pbworks.com/w/page/21246851/Life%20Expectancty%20of%20Males%20and%20Females%20of%20the%20US%20to%20India
Notice how difficult to read this graph is? When the columns are 3D figures, it is harder to visually compare the size of the columns. Since visual comparison is the whole point of column graphs, using 3D columns is a bad idea.
Why Do We Need Bar Graphs?
Often textbooks introducing graphs, they describe bar graphs as a horizontal version of a column graph. So then, why do we need them? Why can't we just use column graphs?
The answer is that bar graphs have a definite advantage when the category names are very long, or when there are lots of them:
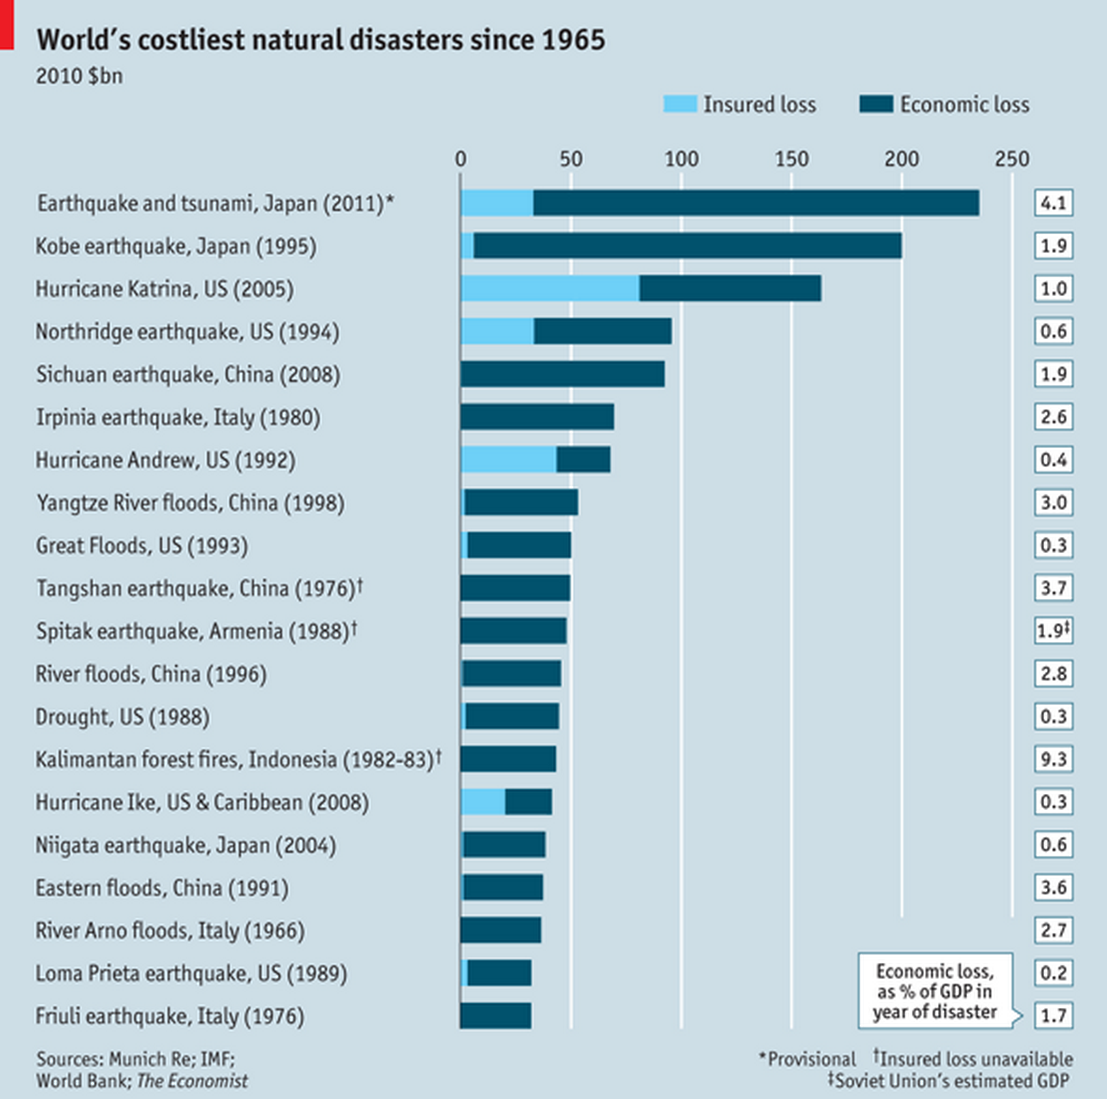
As you can see, the names would be too long for a column graph, and a column graph with this many columns would be confusing. This graph is from The Economist's daily chart, which contains many examples of well-crafted graphs for the enjoyment of graph connoisseurs.
You Want To Show Change Over Time
Mistake #3: Do not use column graphs to show change over time. Use a line graph instead, as these are more suited to showing continuous data.

As you can see, the column graph format is not well suited to showing change over time for one simple reason: there are too many columns. This column also makes mistake #1 (not starting at zero) and mistake #2 (using 3D column graphs) as well!
Now, let's look at a line graph:

You can see how much better this looks. The main reason line graphs work well for time is that time is often divided a large number of data-points (e.g. 5-yearly intervals in this case). On line graphs, a point is just a dot, so even a large number of data-points doesn't ruin the graph. Even if we were to use 1000 data-points, the line would just get smoother and data, whilst the column graph would become an overwhelming forest of columns.
The other reason that line graphs are better in this situation is that they represent data which is continuous. As time goes on, things change smoothly, not all of a sudden.
Note that in line graphs, you are allowed to start at a number other than zero, because line graphs are used to highlight rate of change rather than making a comparison between amounts.
You Want To Show Parts of a Whole
Anytime you are expressing things in percentages which add up to 100%, you shouldn't be using a column graph either. Pie graphs are much quicker to read and understand, as they do not require you to check an axis. They are also simple enough that you can include exact percentages if you want without making the graph overly cluttered.

This set of pie charts, for example, makes its point about the relative frequency of climate change denial amongst scientists and members of the public very succinctly. Even with a lot of exact figures and long category names, this graph does not come out as overwhelming, as it might if we tried to do the same thing with a paired column graph.
Questions
What would be the best choice of graph for:
1. Comparing the GDP of China and the US
2. Showing how the number of internet users has changed over time
3. Showing the percentage of people who would vote for different political candidates
4. Showing the percentage of people who play different sports
Real-Life Graphs
Have a look at the following real-life graphs, and answer these questions:
1. Was the type of graph chosen the right one for the data?
2. Do they make any mistakes in presenting the data?
3. Could you make a better graph to illustrate the same data?
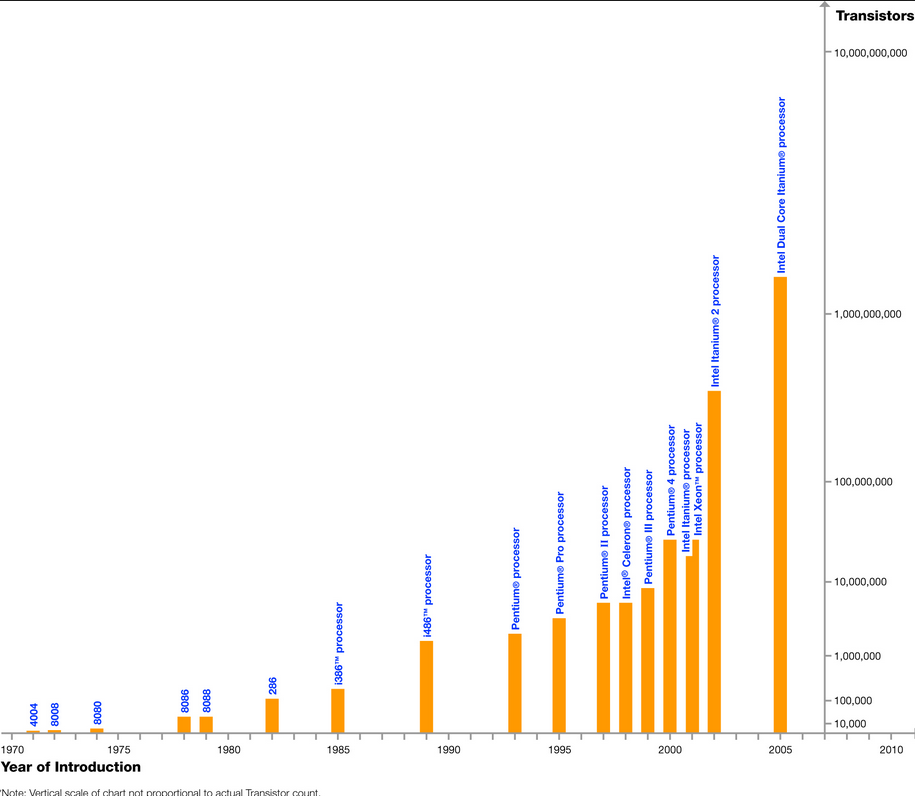
Source: http://www.intel.com/pressroom/kits/events/moores_law_40th/
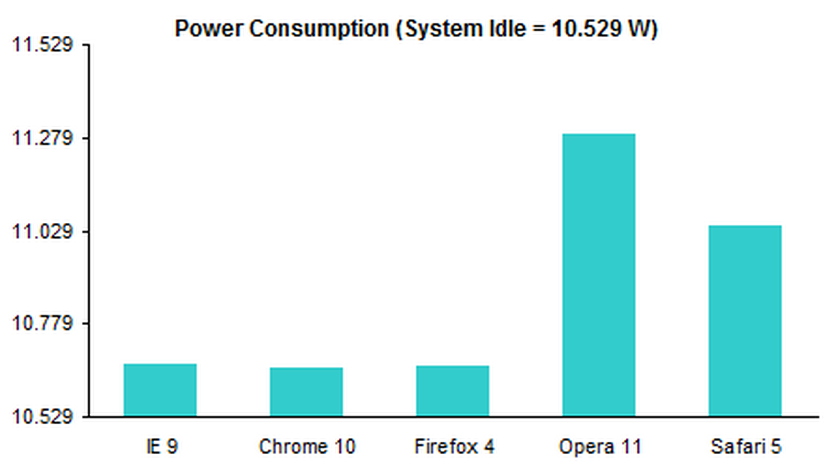
Source: http://peltiertech.com/bar-chart-value-axis-scale-must-include-zero/
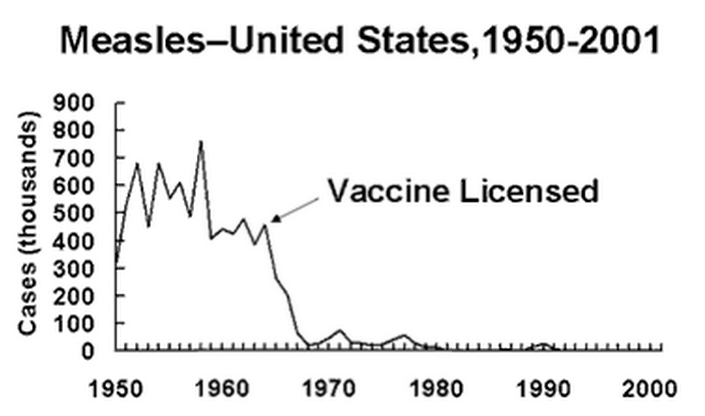
Source: http://www.vaccines.gov/basics/effectiveness/

Source: https://ppmartin.wordpress.com/2009/01/30/internet-users/
Extension: From Graph Master To Graph Wizard
Alright, so now you've got the basics down. You know when to use column graphs, bar graphs, line graphs and pie graphs to succinctly make a point using data. But a true graph wizard can do more than that: they can take huge amounts of data, which would normally be incomprehensible to human beings, and make them understandable. As "big data" becomes even "bigger", the need for people with the skill to present huge data-sets in a comprehensible way is growing. The art of "data visualisation" takes years to master, and you can even do a university degree in it, but here we'll run through a quick introduction to some of the more advanced types of graphs which such wizards may use.
Bubble Charts
Generally speaking, it is only possible to show two independent variables in one graph, because graphs are two dimensional. If we wanted to try to show three variables, we could possibly do this with a simulation of a cube. However, if we were to try to show four separate variables, we would need a four-dimensional hypercube, which would be pretty difficult.
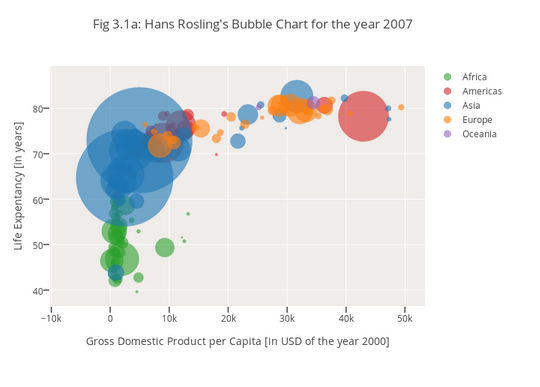
However, we can sidestep this difficulty by using bubble charts, which use not only the position of the dots, but also their size and colour to successfully convey four independent variables.
Have a look at this chart, taken from Hans Rosling's presentation on life expectancy mentioned earlier:
Source: https://plot.ly/python/bubble-charts-tutorial/
Here the x-axis shows GDP, the y-axis shows life expectancy, the size shows population, and the colour shows which region of the world the country is in.
Hans Rosling's presentation goes one step further than this, adding motion to the graph as well, bringing the total to five independent variables.
Data Visualisation Challenge: Solve The Mystery Of The Sleepy Maths Students
Although such magical graphs may seem out of reach for a high school student, they are not! These kind of graphs used to require expensive software, but now they are available for free using Google Sheets.
Imagine the following scenario: maths students are getting sleepy during the summer . The teachers don't know why this is. Is the maths too hard, and this is making them sleepy? Or is it the hot weather? Being mathematicians, the teachers decide to gather data on their five maths classes over one week of lessons, and record the temperature and the number of sleepy students.
| Maths Class | Date | Temperature | Difficulty of Maths | Number of Sleepy Students |
|---|---|---|---|---|
| One | 01/02/2015 | 25 | 3 | 7 |
| One | 02/02/2015 | 31 | 4 | 14 |
| One | 03/02/2015 | 22 | 6 | 2 |
| One | 04/02/2015 | 28 | 5 | 11 |
| One | 05/02/2015 | 31 | 2 | 14 |
| One | 06/02/2015 | 24 | 8 | 6 |
| One | 07/02/2015 | 28 | 4 | 10 |
| Two | 01/02/2015 | 23 | 4 | 4 |
| Two | 02/02/2015 | 25 | 10 | 10 |
| Two | 03/02/2015 | 29 | 8 | 10 |
| Two | 04/02/2015 | 28 | 6 | 13 |
| Two | 05/02/2015 | 22 | 6 | 5 |
| Two | 06/02/2015 | 23 | 8 | 6 |
| Two | 07/02/2015 | 28 | 1 | 8 |
| Three | 01/02/2015 | 20 | 5 | 5 |
| Three | 02/02/2015 | 32 | 7 | 15 |
| Three | 03/02/2015 | 20 | 1 | 0 |
| Three | 04/02/2015 | 23 | 6 | 5 |
| Three | 05/02/2015 | 21 | 3 | 4 |
| Three | 06/02/2015 | 32 | 7 | 14 |
| Three | 07/02/2015 | 26 | 10 | 7 |
| Four | 01/02/2015 | 32 | 9 | 14 |
| Four | 02/02/2015 | 21 | 6 | 1 |
| Four | 03/02/2015 | 32 | 5 | 15 |
| Four | 04/02/2015 | 28 | 4 | 11 |
| Four | 05/02/2015 | 30 | 4 | 15 |
| Four | 06/02/2015 | 22 | 8 | 6 |
| Four | 07/02/2015 | 20 | 2 | 0 |
| Five | 01/02/2015 | 21 | 4 | 4 |
| Five | 02/02/2015 | 30 | 1 | 14 |
| Five | 03/02/2015 | 20 | 5 | 0 |
| Five | 04/02/2015 | 23 | 4 | 6 |
| Five | 05/02/2015 | 30 | 4 | 15 |
| Five | 06/02/2015 | 20 | 8 | 2 |
| Five | 07/02/2015 | 31 | 4 | 16 |
The problem is, although they've got all this data, it's too hard to read to figure out what's going on. See if you can make a motion bubble chart to figure out what is going on.
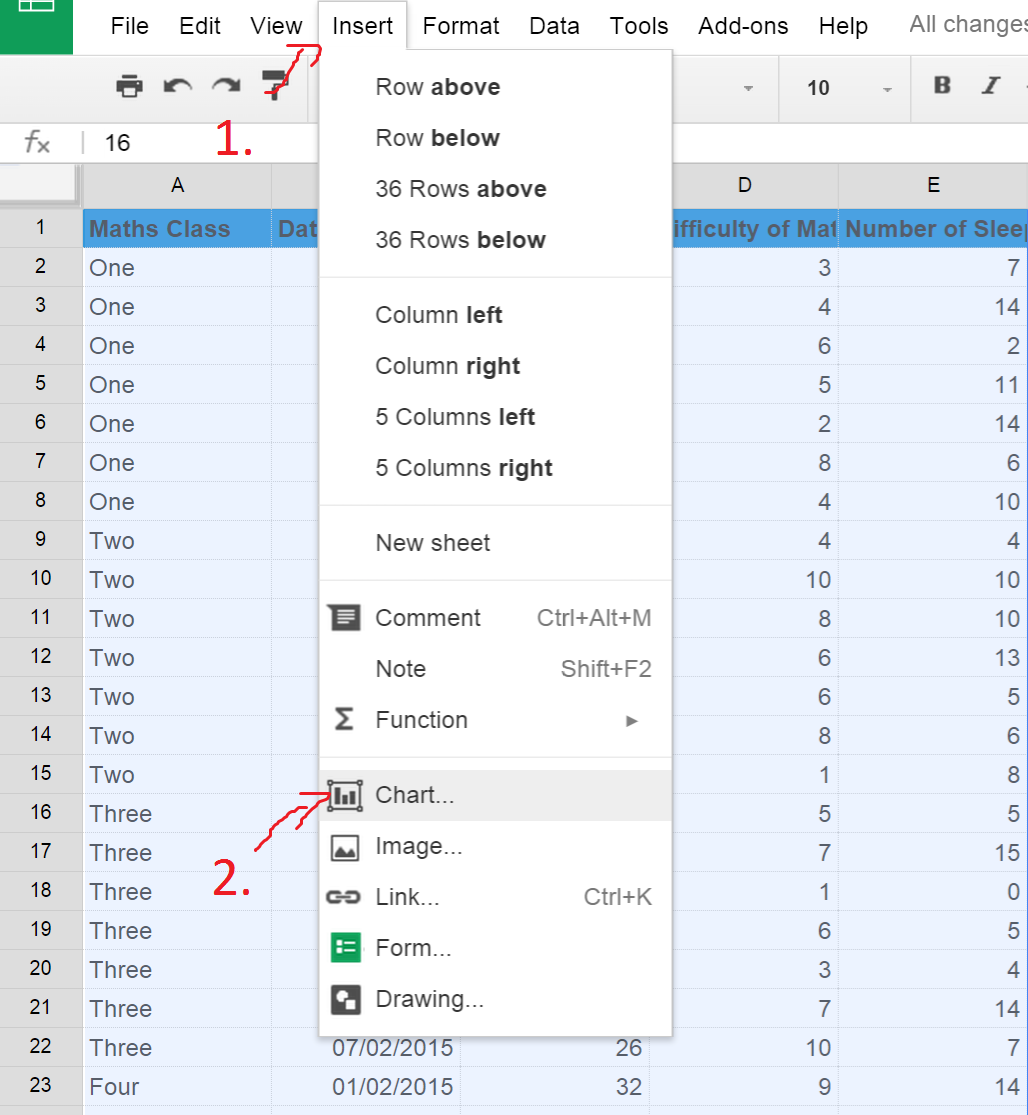
Just open up Google Sheets, make a new spreadsheet, and copy and paste this data in. Next, select all of this data and click "insert", "chart", then select the "charts" tab, click "Trend" in the left hand column, then select the third chart down and click "Insert". If all that was too complicated, here's some pictures:
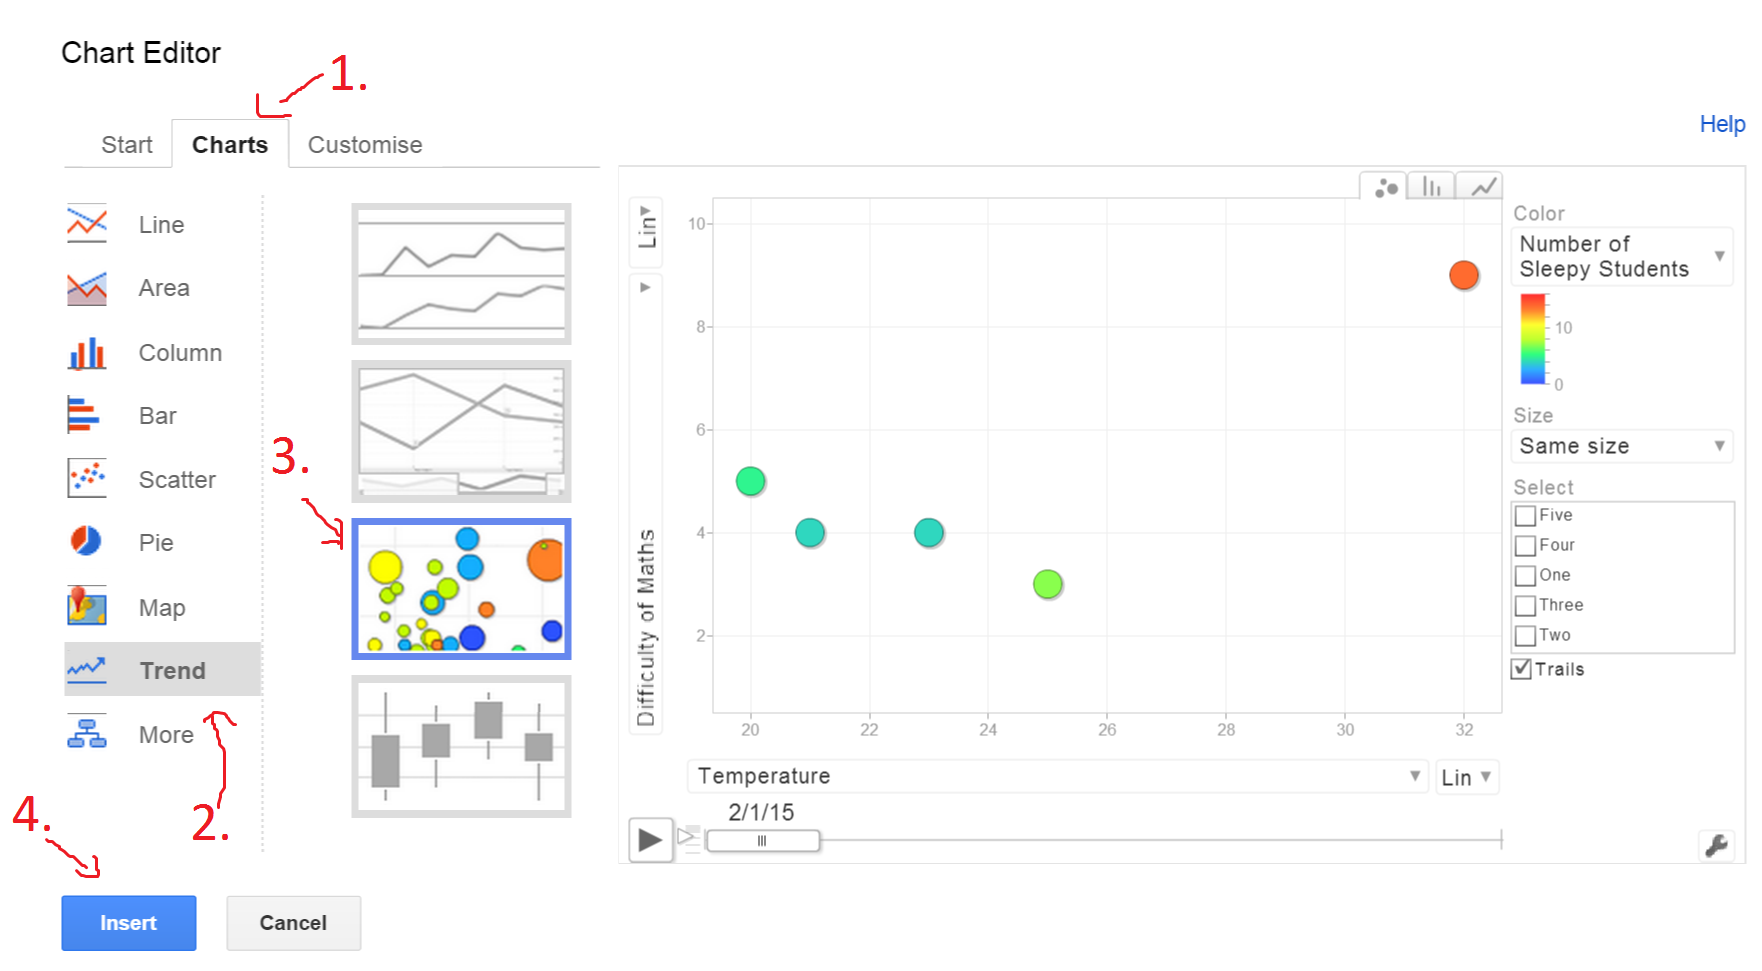
On the chart that comes up, click the play button to watch the bubbles fly around. See if you can use this chart to solve the mystery of what is making the students so sleepy!
With Great Power Comes Great Responsibility
Now that you have your new powers to use data to make a point, you must use them for good, not evil. Graphs are powerful visual tools which convince people that "the facts" support what you are saying, and can easily be used to mislead people. Make sure you use your graph-creating powers to help show people what the data actually says, rather than what you would like it to say!
