
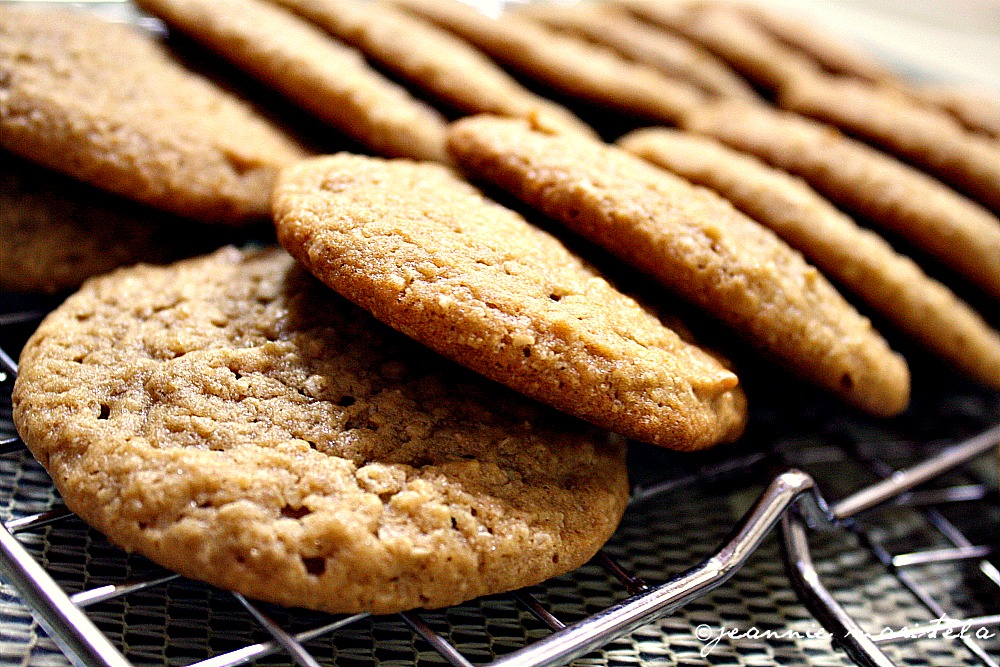
Did you know that by analysing a small sample that is representative of a population we can get a good idea of what the entire population is like? You have probably had experience with this before, whether knowingly or unknowingly. Consider the following scenario. You have just finished baking 100 cookies. Before you take them to your friend’s party, you have to check whether they taste good or not, so you decide to do a taste test. How many cookies should you eat to check? All of them? Of course not! If you ate all of them, there wouldn’t be any left for your friend’s party! It is enough to eat just a few of them because by doing this you are essentially using a sample to get an indication of what the whole population of 100 cookies tastes like.
Uses of samples
What are some other instances of when samples may be used? Well, they can be used for measuring aspects of the economy such as how many people are unemployed at a given time, or gauging people’s opinions on a range of topics, as well as for testing water quality, testing for dangerous biological or radioactive hazards, etc. The list is endless.
Selecting a sample
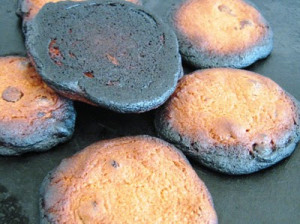
In all these cases, the sample used must be representative of the whole population. For instance, if you wanted to taste test your batch of cookies, you’d have to taste both the burnt and non-burnt ones. Otherwise, if you’d tasted just the burnt ones you’d think that your entire batch of cookies tasted a bit off. If the sample you use is not representative, then it is said to be biased.
Let’s go through the concept of unrepresentative samples in a bit more detail. Samples can be unrepresentative either because of the way they were chosen or because of chance (bad luck). Choosing to taste only the burnt cookies was an instance of a sample being unrepresentative because of how it is chosen. What you should do instead is to select cookies at random (by closing your eyes when choosing) to taste. That way your sample will likely contain a mixture of both burnt and non-burnt ones.
But notice that I mentioned likely. This is because even if you chose a sample of cookies at random, the sample could have still been unrepresentative as a result of chance. For example, through bad luck, you could have picked just the burnt ones. As another example, consider a standard deck of cards. If you picked four cards at random from a deck that is face down on a table, you could quite possibly select four kings through luck. Obviously, this sample of four kings is not representative of the entire deck but this is the result of luck, not the result of the way you chose the sample of cards.
So just to recap: a sample can be unrepresentative because of how it is chosen or because of chance. But it is only said to be biased if it is unrepresentative due to how it is chosen.
Stratified sampling
Sometimes simply choosing members from a group at random may not be enough to create a representative sample. In other words, a simple random sample may not be a representative sample. (A random sample is one in which every member of the population is equally likely to be selected to be in the sample.) For example, imagine you want to know the level of support for a women's health club that the local council is considering building. So you decide to carry out a survey. Now suppose 90% of your town is female and 10% is male. If you select a random sample, the sample will not necessarily be in the same proportion of females to males as that in the population (i.e. in your town). Put simply, there isn’t a proper representation of each gender. You may be wondering why this is a problem? Well, it wouldn’t be a problem if a person’s gender has no effect on whether they support the building of the women's health club. But this is unlikely to be the case since the health club will be exclusive for women and so you’d think that women are more likely to favour the idea of building it than men. So for a sample to be representative in this instance, it has to include the same proportion of females and males as in the town. That is, 90% of people in the sample should be female and 10% should be male. Such a sample is called a stratifiedsample.
Let’s go through exactly how we would calculate the exact number of females and males in a stratified sample of 50. To find the number of females, we simply multiply 90% (the proportion of females in the town) by 50 (the sample size). So we get 90% x 50 = 45 females. For the number of males, we get 10% x 50 = 5. But how do we select these 45 females and 5 males? Well, we simply select 45 females at random from the town’s females and select the 5 males at random from the town’s males.
The aspect of the population that may be relevant when you select a stratified sample will vary depending on what you are trying to investigate. For example, if you want to find out what people think about the government’s new income tax policy, you would have to use a sample that properly represents people from each income bracket.
Sometimes you may have to categorise a population by more than one aspect. For example, you may have to categorize a population according to both gender and age. The table shows a breakdown of the population of students at ABC High School.
| Age | |||||||
|---|---|---|---|---|---|---|---|
| 12 | 13 | 14 | 15 | 16 | 17 | Total | |
| Male | 76 | 80 | 78 | 76 | 83 | 77 | 470 |
| Female | 74 | 75 | 69 | 71 | 65 | 76 | 430 |
| Total | 150 | 155 | 147 | 147 | 148 | 153 | 900 |
If you want to calculate the number of students needed to represent each category, you have to follow the steps in the example above. Multiply the proportion that the group makes up by the sample size. For example, the number of 13-year-old girls that should be included in a sample of 100 is 75/900 x 100 = 8 (rounding to the nearest integer).
Measuring TV audiences
Let’s go through an in-depth example of the use of a sample in a real life context. Consider the following question. How many people watched the football game on TV on the weekend? How would you go about answering this question? While it would be theoretically possible for you to count the actual number of people tuned in to the game, this wouldn’t be practical given the large number of people who watch TV. This is where samples come in. Not only are they more efficient, but they also enable us to gain insight easily into the demographics of the viewing population such as age, gender, etc.
Selecting a sample

But how do television ratings companies create samples? How do they decide who is included in them?
Basically, a television ratings company creates a sample audience by selecting a random sample that is representative of all viewers. The exact process may vary slightly for each company, but the essential point is that the sample they gather has to reflect the demographics of the whole population. Once a sample of households has been selected, meters are then installed in their homes to track when their TVs are on and what programs they are watching. From this process, the company can track the number of people watching a particular program and can then project the result to the entire population. For example, if they wanted to know how many people watched a football match, they simply count the number of people in the sample audience that watched the match, and then generalise from this sample audience to estimate how many people in the whole population watched the match. Not only that, they can also estimate the age, gender, city and other characteristics of the viewers.
Ratings accuracy
How many households do you think a ratings company has to include in the sample for it to be 99% confident of its predictions? Do you think it would be in the millions or in the hundreds of thousands? Or in the tens of thousands maybe? In reality, a sample size of 3000 people would yield a margin of error of approximately 1%.
Selecting a sample that is truly random
Let’s imagine Mitch wants to find out the favourite colour of students in his math class. He doesn’t want to spend a lot of time on this investigation so instead of asking every single person in his class, he decides to harness the power of sampling and ask only a few of them. He decides to only ask 8 of them. He knows that he’s supposed to select the students to be included in this sample “at random”, but how exactly does one go about doing this?
Should Mitch look at the class roll and simply pick out a few names? The answer is no, because this may be affected by subtle personal preferences that he wouldn’t be aware of and the sample would then not be representative. The people he selects might, for example, be the ones he is friends with, or the ones he hate the most, or the ones that he doesn't know so well. As you can tell, the sample would then not be representative and the results would then be misleading. If the sample was made up of only avid Manchester United football fans, for example, then he might mistakenly think that the most popular colour among students was red.
A better way to select a random sample is to allocate a number to each student such as by allocating a number from 1 to 30 as we go down the class roll. It doesn’t matter how the numbers are allocated. We can then select students to be included in the sample by using any method that produces random numbers. One of the easiest methods would be to use the random number generator on a (scientific) calculator.
| 2850 | 3289 | 2934 | 6201 | 4773 |
| 4189 | 6380 | 1827 | 1269 | 6104 |
| 8661 | 2506 | 5929 | 6430 | 0293 |
| 3276 | 4302 | 1470 | 1736 | 8924 |
| 2539 | 0794 | 7365 | 1809 | 0472 |
But the method we will discuss in detail is the use of random number tables, which as the name suggests are just tables of random numbers. They are made up of the digits from 0 through 9. To use them, we need to select a starting point. It doesn’t matter where this is and it doesn’t matter whether numbers are chosen by going across rows, down columns, diagonally or any other weird way.
Here we describe one of many possible ways. Suppose we start at the intersection of the 3rd row and 3rd column and we decide to read across rows. To get 8 numbers (for Mitch’s sample of 8) at random from the table, we have to read from left to right from 5929 onwards and find two-digit numbers that are less than or equal to 30 (since the students in Mitch’s class have been allocated numbers from 1 to 30 only), keeping in mind to ignore repeated numbers.
Let’s go through this step-by-step. Reading from left-to-right, we get
59 29 64 30 02 93 32 76 43 02 14 70 17 36 89 24 25 39 07 94 73 65 18 09 04 72
We ignore the second “02” since it is a repeat, and we use only the numbers that are less than or equal to 30. This leaves
29 30 02 14 17 24 25 07 18 09 04
Since we are after 8 students to include in the sample, we only need the first 8 numbers. This leaves
29 30 02 14 17 24 25 07
We can then use these numbers to find the names of the students they correspond to.
Exercises
1. Rob, Nick and Marcel are having an argument about what the most popular sport among students at their school is. Rob thinks it is football, Nick thinks it is netball, while Marcel thinks it is cricket. To settle the argument once and for all, they decide to carry out a survey. But instead of collecting the data together as a group, they each go out on their own. Rob goes and asks his teammates in the school football team, Nick asks members in the girls dancing class and Marcel asks everyone who is stuck in after-school detention with him. The following table shows the results of their investigation.
| % football | % netball | % cricket | |
|---|---|---|---|
| Rob | 90 | 5 | 5 |
| Nick | 0 | 80 | 20 |
| Marcel | 30 | 30 | 40 |
- How has the choice of sample affected the reliability of the results of:

i) Rob
ii) Nick
iii) Marcel
- Rob points out that the 90% support for football in his survey is higher than the 80% support for netball and the 40% support for cricket found in the others’ surveys, and claims that this is proof of football being more popular than the other sports. Is this claim valid?
- Marcel points out that the sample used in his survey is less biased than the samples used by the other two and argues that his findings are therefore more reliable. Is he right?
- Would your answer change if it turned out that the majority of students in detention are there as a result of shattering windows during games of cricket during lunchtimes?
- What would have been the proper way to carry out the survey?
2. Britney is in charge of coming up with the town’s budget. One thing she is undecided on is whether to spend money on a new music hall for the town’s residents. So she decides to carry out a survey to gauge the residents’ support for building a new music hall. She is also unsure how to select the sample for this survey and so consults her husband who suggests the following methods. For each method, comment on whether the sample gathered would be representative and suggest changes that could be made to improve the method.
- Interview students and teachers at the local music school.
- Interview passengers waiting at a bus stop and passengers alighting from the bus
- Perform a letterbox drop of questionnaires along the street on which the music hall will be built
- Interview people entering the local newsagency, offering a $20 reward for those who agree to participate
- Post questionnaires to people whose names are longer than 20 letters on the local electoral roll
3. Imagine that you have been made in charge with investigating students’ satisfaction with the performance of your school principal. How would you go about selecting a representative sample from the entire student population? Consider who you will ask, the questions you will ask them, and where and when you will ask them.
4. Are the samples in the following instances representative samples? If they are not, who or what should have been included for them to have been representative?
- asking a random selection of students in your class whether they approve of the principal to find out the approval rating of the principal
- carrying out a taste test of a large batch of cookies you have just baked by eating only a few of the burnt ones
- conducting a survey to find the most popular teacher in the school by asking students from one class
- carrying out a crash test of new cars just manufactured by a factory by crashing every 100th car built
- determining the number of people in the country watching Masterchef by surveying members of a random cooking class
- determining the average height of students in your class by measuring the height of a few randomly selected girls in your class
- determining the number of students with blue eyes by counting the number of students with blue eyes in your class
- determining the average heart rate of healthy students by measuring the heart rate of all students at a sports high school
- conducting an opinion poll by surveying a random sample of AM radio listeners
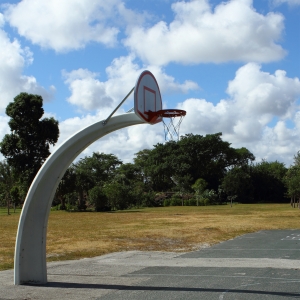
5. Principal Chris is considering building a new basketball court for students to use during lunchtimes, but first he has to find out whether students support the idea. So he decides to personally interview students to get their thoughts on the idea. But due to time constraints he is only able to directly talk to 120 students.
The following table shows the number of students in each year group at a particular high school which has 900 students.
| Year | 7 | 8 | 9 | 10 | 11 | 12 |
|---|---|---|---|---|---|---|
| Number of students | 176 | 180 | 164 | 171 | 101 | 108 |
- How many students should be chosen from each year group to form a representative sample of 120 students?
- After a check of his timetable, he discovers that he only has time to talk with only 10% of all students. How many students should be chosen from each year group to form a representative sample that is 10% of all students?
- After talking to the sample of students, he discovers that 60 of them support the idea of building the new basketball court. Estimate how many students in the entire school support the idea.
- Do you think it was appropriate to use a stratified sample in this case?
6. Principal Chris would also like to interview some students to find out the most popular sport among students at the school. But again, given his lack of time he is only able to talk with a few of them. Not only that, he does not even have the time to select the sample himself, so he asks his secretary Mabel to select a sample for him. Instead of selecting random students by year group as Chris did previously, Mabel selects a random sample that is not stratified. That is, she selects students from the entire school at random.
- Do you think the sample generated by this method is likely to be representative of the students?
- Upon hearing of Mabel’s method of generating the sample, Chris decides that it is better to create a stratified sample by categorizing students by the sport team they are in. But there is an obvious problem with this method – some students are in more than one sports team and some students aren’t in a team at all. How would you go about categorizing these particular students?
7. The table shows a breakdown of the population of students at ABC High School.
| Age | |||||||
|---|---|---|---|---|---|---|---|
| 12 | 13 | 14 | 15 | 16 | 17 | Total | |
| Male | 76 | 80 | 78 | 76 | 83 | 77 | 470 |
| Female | 74 | 75 | 69 | 71 | 65 | 76 | 430 |
| Total | 150 | 155 | 147 | 147 | 148 | 153 | 900 |
How many students should be included from each of the 12 categories to form a representative sample of 90?
Imagine you have just won 5 boxes of chocolates as part of a competition. Unfortunately, you do not eat chocolate, so you decide to give away the 5 boxes to students in your class. You want to be fair and so you decide to select 5 students at random to give the boxes of chocolates to. Use the following list of random numbers to select a random sample of 5 students from your class.
| 4284 | 3762 | 5710 | 9375 | 0829 |
| 6235 | 1286 | 4208 | 1678 | 3014 |