
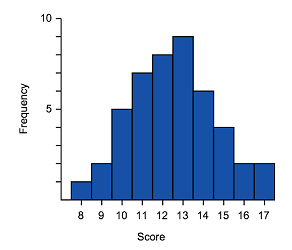
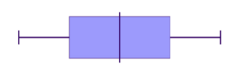
So we have already seen how data can be displayed in histograms and in box plots. These two displays are great for being able to identify key features of the shape of the data, as well as the range and in the case of the box plot the inter-quartile range and the median.
We should expect then that the shape of the data would be the same whether it is represented in a polygon, box plot or histogram. Remember that the shape of data can be symmetric, left skewed or right skewed.
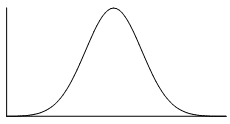
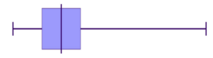
Symmetric
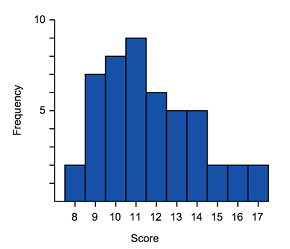
Positive skewed (also called skewed right)
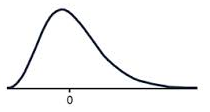
Negative Skewed (also called skewed left)
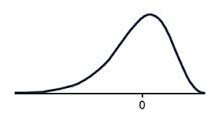
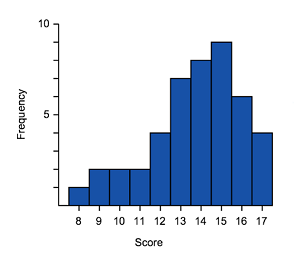
Looking at the diagrams above, can you see the similarities in the representations?
We can see the skewed tails, where the bulk of the data sits and general shape. These are some of the features you can use to match histograms and box-and-whisker plots. You can also look at the data range.
Let's see if you can match histograms to their correct box plot representation.
Example
Match the box plots and histograms together.
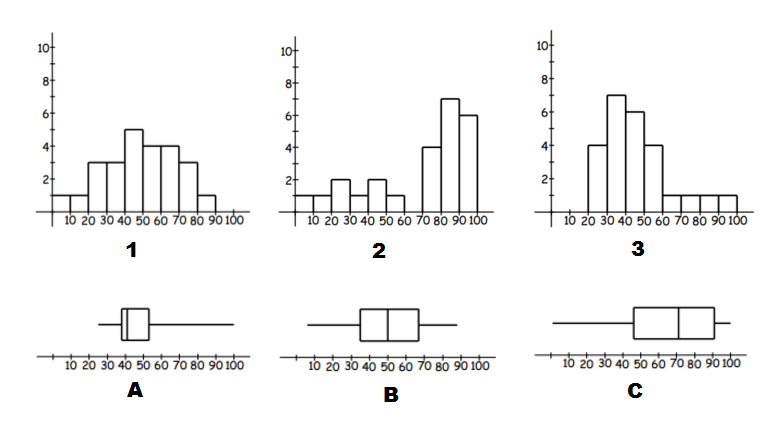
To identify matching data start by identifying tails (left or right) and symmetric type data.
- I can see, that A and 3 have right tails, and thus are both right skewed. So they are a match.
- C and 2 have left tails, and thus are both left skewed and so are a match.
- Which leaves B and 1, Which are both symmetric data.
Worked Examples
question 1
Match the bar graph shown here to the correct box plot.
- 102030405060708090
A box plot has a horizontal axis ranging from $10$10 to $90$90 marked in major intervals of $10$10 and minor intervals of $5$5. The minimum value starts at $30$30. The left side of the box is at $40$40, the median value is at $50$50, and the right side of the box is at $60$60. The maximum value ends at $70$70. A102030405060708090A box plot has a horizontal axis ranging from $10$10 to $90$90 marked in major intervals of $10$10 and minor intervals of $5$5. The minimum value starts at $10$10. The left side of the box is at $20$20, the median value is at $30$30, and the right side of the box is at $40$40. The maximum value ends at $90$90. B102030405060708090A box plot has a horizontal axis ranging from $10$10 to $90$90 marked in major intervals of $10$10 and minor intervals of $5$5. The minimum value starts at $10$10. The left side of the box is at $60$60, the median value is at $70$70, and the right side of the box is at $80$80. The maximum value ends at $90$90. C102030405060708090A box plot has a horizontal axis ranging from $10$10 to $90$90 marked in major intervals of $10$10 and minor intervals of $5$5. The minimum value starts at $10$10. The left side of the box is at $20$20, the median value is at $50$50, and the right side of the box is at $80$80. The maximum value ends at $90$90. D
question 2
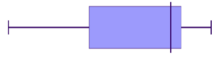
Match the box plot shown to the correct bar graph.
- ABCD
question 3
Consider the following pairs of histograms and box plots:
Which two of these histograms and box plots are correctly paired?

 A
A
 B
B C
C D
DIn part (a) we determined that the following histogram/box plot were an incorrect match:
Which two of the options correctly describe why?
The box plot has a long tail to the right which indicates positive skew, while the histogram does not appear to be skewed.
AThe data on the histogram is widely spread, while the box plot indicates that the data is mostly located around the median.
BThe median for the histogram is roughly in the middle, while the median of the box plot is located further to the left.
C