
Data in the Media
Making Your Voice Heard
Polls are surveys of people's opinions or choices, similar to votes and they are a very common example of data in the media.
Popular Polls
Heaps of TV networks, radio stations and websites ask people to vote in polls about their favourite programs.
Activity
US Magazine created a poll and asked people to vote on who was going to win The Voice. Here are the results.

1. Who did most people say would win The Voice? How many votes did he/she receive?
2. Which two people did the least number of people think would win?
3. How many people participated in the poll in total?
4. What type of graphs are used in this poll? Why might this type of graph had been chosen?
5. $1086$1086 people voted for Koryn Hawthorne, while $1046$1046 people voted for Joshua Davis. However, the graph says they both received $10%$10% of the votes. Why might this be?
Political Polls
One of the most common uses of data in the media is political polls. News shows use polls to tell viewers things such as which political party is more popular or which candidate is more popular.
Activity
Here is a political poll that was reported in The Herald Sun.
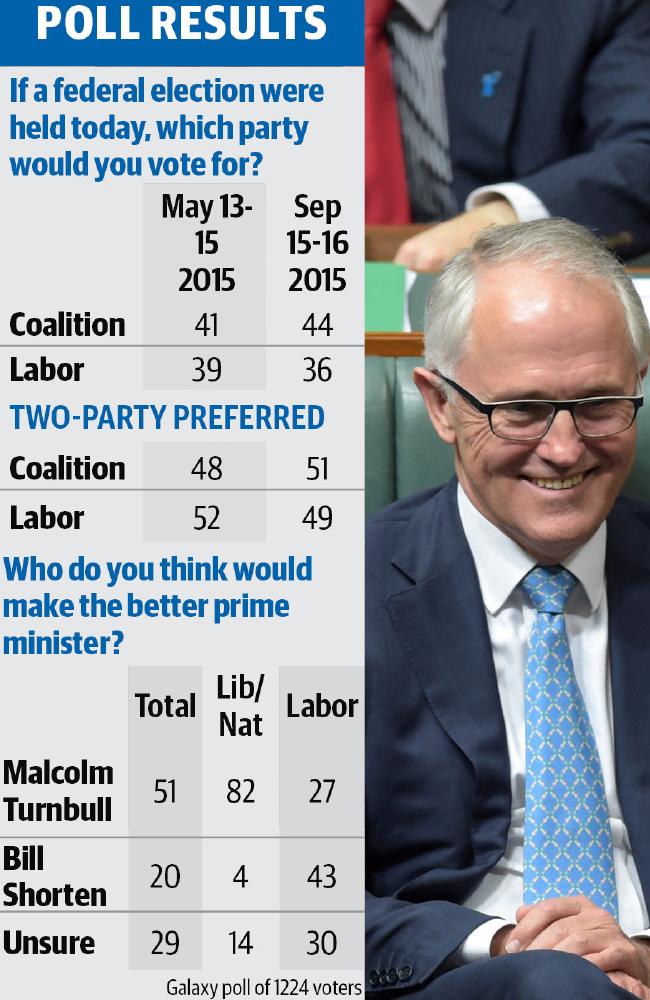
1. What percentage of people said they would vote for Labor if the election was held that day in May?
2. Who did $82%$82% of Liberals/Nationals pick as their preferred Prime Minister?
3. How many people were surveyed in total?
4. The statistics for 15-16 September 2015 only add up to $80%$80% ($44%+36%$44%+36%). Why might this be?
Data in Sport
Tables are also used by sports leagues so people can easily see which teams are doing well. They are an easy way of showing who will qualify for finals and who will be wooden spooners (last on the table).
Activity
Here is a table of results from the English Premier League on FM Base. Just in case you are not familiar with sports tables, here is an explanation of the abbreviations.
| Position | Team | Games Played | Wins | Draws | Losses | Goal Difference | Points |
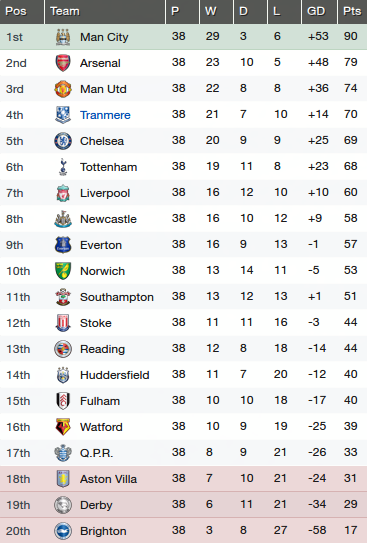
1. Which team is in ninth position on the table?
2. Which team won the most games? Which team drew the most games? Which team lost the most games?
3. How many points did Q.P.R. finish on?
4. When would a team have a positive goal difference (GD)? When would they have a negative goal difference (GD)?
Worked Examples
QUESTION 1
Did you know most of your body is made of water?
This graph shows on average, the percent of water that different body parts are composed of, as well as the average total percent of water in the body.

Which body part is comprised of $80%$80% water?
cells
Ablood
Bbrain
Cmuscles
DWhich body part is comprised of $5%$5% more water than muscles?
blood
Abrain
Bcells
C
QUESTION 2
In Britain, the Natural Environment Research Council decided to crowd-search a name for its latest polar research vessel.
Use the information in the diagram to answer the following questions.

How many entries had been received for names of the vessel?
How many people voted for the name "Boaty McBoatFace"?
QUESTION 3
Here is a table of results for the 2015 AFL season.

If the top $8$8 teams play in the finals, which of these teams did not make the finals?
Sydney Swans
ANorth Melbourne
BAdelaide Crows
CPort Adelaide
DHow many more points did Richmond score than Collingwood over the season?