
Distance/Time Graphs and Time Series Data
A time series can be thought of as a bivariate data set in which the explanatory variable is time. In examining time-series data, a researcher is looking for a relation between elapsed time and some other variable of interest. There may be a clear trend in the variable over time, there may be an oscillating pattern, or there may be nothing more than irregular fluctuations.
A trend or pattern in a time series would not usually be attributed to the passage of time itself as a cause, but it would suggest the presence of one or more genuine causal factors.
A time series graph, although constructed from a finite set of measurements recorded at discrete times, may often be drawn with continuous line segments connecting the known data points - giving the possibly misleading impression that the variation between measurements was linear and smooth.
A graph of stock price changes over time, for example, may show a value taken at the close of each day of trading and these values might be connected by a line on the graph. Note, however, that the line between the recorded values masks any fluctuations that may have occurred during the day.
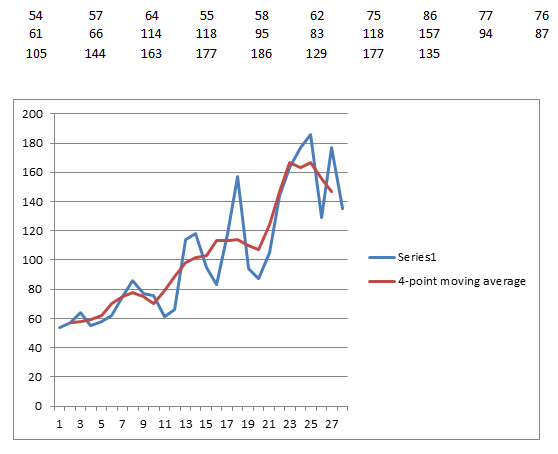
On the other hand, it may be desirable to smooth out short-term fluctuations in a time series by an averaging process that helps to clarify an underlying trend by suppressing unimportant variations. A moving-average that takes successive overlapping groups of a specified small number of measurements and plots their averages has this effect.
Example 1
The following data set is a time series taken over a 28-day period. The graph shows a plot of the raw data and also a plot of the 4-point moving average showing the smoothing effect.
Example 2
In a time series, we may consider the average rate of change of the variable being measured over some time interval.
In economics, the average rate of change of the price of a certain basket of goods and services is investigated over each quarter of the year. It is called the inflation rate.
In a graph showing changes in distance from some starting point over time, we interpret the steepness of each segment of the graph as the time rate of change of distance for that segment. Depending on the type of the motion involved, this is called speed or velocity.
More Worked Examples
QUESTION 1
Use the graph to answer the following questions.
What was the blood sugar level after $12$12 hours?
$9$9
A$18$18
B$22$22
C$15$15
DWhat was the change in the blood sugar level between hours $8$8 and $12$12?
no change
Aan increase of $9$9
Ba decrease of $12$12
Ca decrease of $9$9
D
QUESTION 2
During a live debate, each speaker has $10$10 minutes to address the audience. At any time during the $10$10 minutes the audience can electronically vote their approval or remove their approval for the speaker. A ‘worm’ graphs the number of approvals over the $10$10 minutes.
In the last two minutes $29$29 new people voted their approval and $13$13 people removed their approval for the speaker. How many approval votes did the speaker finish with at the end of $10$10 minutes?
QUESTION 3
The graph shows a traveller's distance from home each hour.

At what speed was the person travelling between $11$11am and $1$1pm?
In which interval of time was the person travelling fastest?
Between $\editable{}$ and $\editable{}$
What does the horizontal interval on the graph represent?
Stopping for rest
AReturning home
BTravelling in a straight line
C