
Categorical Data I (collecting and displaying)
Categorical data is data that is sorted by groups or categories. Often we look at categories people fit into, such as hair colour, eye colour or gender. However, it doesn't always involve people, types of dogs people own, colours of marbles in a jar or even whether a coin lands on heads on tails are also examples of categorical data.
Let's look now at how we can collect and display categorical data.
1) Decide What Information You're Going to Collect
This is also called a research question. For this example, I want to know what coloured marble is most common in this jar.

2) Construct a Frequency Table
Your frequency table should list all possible outcomes for the experiment you are running. What outcomes are possible in my experiment? Well, there are green, red and blue marbles in the jar- these are all the possible outcomes. My frequency table would look something like this:
| Colour | Tally | Total |
|---|---|---|
| Red | 7 | |
| Green | 10 | |
| Blue | 3 |
3) Create a graph to display your results
Remember different graphs are suited to different types of data. Bar graphs, column graphs, divided bar graphs or pie charts are good ways to display categorical data. Here is my data displayed in a pie chart.
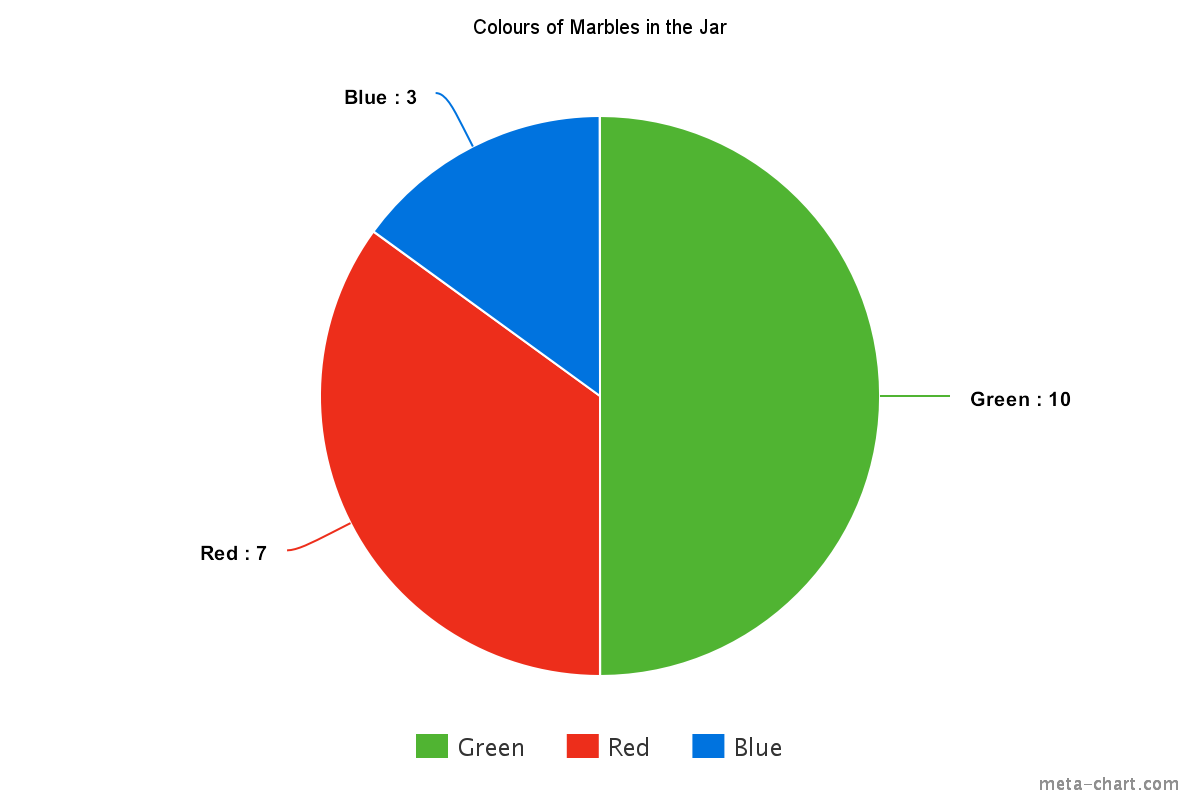
Now we can clearly see that green is the most common colour of marble in the jar.
Worked Examples
Question 1
The table shows Year 5's answers to the survey question "Do you own a pet?".
What is the best way to display this data?
| Yes | 94 |
|---|---|
| No | 16 |
Sector (pie) graph.
ALine graph.
B
Question 2
Tom took a survey of people's eye colours in his year at school.
Complete the table.
Eye Colour Tally Frequency Brown |||||||||||||||||$\editable{}$ Black ||||||||||||||||$\editable{}$ Blue ||||||||||$\editable{}$ Green |||| $\editable{}$ Other ||||||||||||||$\editable{}$ How many people took part in the survey?
What is the rarest eye colour?
Brown.
AOther.
BBlack.
CGreen.
DBlue.
EComplete the column graph using the results from the table above.
Question 3
The divided bar graph shows the percentage of each coloured jelly bean in a pack.

Which colour jelly bean is the rarest?
Orange
APurple
BBlue
CGreen
DRed
EWhich two colours are equally common?
Blue
AGreen
BPurple
COrange
DRed
EWhat fraction of the total jelly beans does the colour Orange represent?