6.03 Logarithmic functions
Logarithmic functions
Exploration
For f\left(x\right)=2^x:
- Sketch the graph of f\left(x\right) and f^{-1}\left(x\right) on the same coordinate plane.
Compare the characteristics of f\left(x\right) and f^{-1}\left(x\right). What do you notice?
When we graph the inverse of an exponential function, we get a logarithmic function.
The points that were approaching the y-axis on the parent exponential function are now approaching the x-axis in the logarithmic function. This means the parent logarithmic function will have a vertical asymptote.
When we examine the end behavior on the left side of the graph, we cannot look at what is happening as x approaches negative infinity because the graph never crosses the vertical asymptote at x=0. Instead, the x-values approach a single value, in this case x=0. To indicate that x is approaching 0 from the positive side, we use the notation x\to 0^{+}.
Since a logarithm is defined as the inverse of an exponential equation, we can use this relationship to evaluate logarithmic functions. Remember that the output of a logarithmic function represents the exponent that the base must be raised to.
Consider the function f\left(x\right)=\log_4{x}. If we want to find the output when x=16, we can use the inverse relationship to evaluate the logarithm. \log_4\left(16\right)=2\text{ because }4^2=16
When the base of a logarithm is not written, the understood base is 10.
\log\left(x\right)=\log_{10}\left(x\right)
Examples
Example 1
Determine if the following graphs and table represent a logarithmic function.
| x | 1 | 2 | 4 | 8 |
|---|---|---|---|---|
| y | 0 | 1 | 2 | 3 |
Example 2
Given g\left(x\right)=\log_\frac{1}{2}\left(x\right) is the inverse of f\left(x\right)=\left(\dfrac{1}{2}\right)^x.
Use the graph of f\left(x\right)=\left(\dfrac{1}{2}\right)^x to create a table of values for the logarithmic function.
Graph g\left(x\right)=\log_\frac{1}{2}\left(x\right).
Compare the asymptotes, domain, range, and intercepts of f\left(x\right)=\left(\dfrac{1}{2}\right)^x and \\g\left(x\right)=\log_\frac{1}{2}\left(x\right).
Example 3
Consider the function f\left(x\right)=\log_3\left(x\right).
Identify the increasing or decreasing intervals.
Determine the end behavior.
State the domain and range of f\left(x\right)=\log_3\left(x\right).
Evaluate f\left(x\right)=\log_3\left(x\right) when x=81.
We can use the inverse relationship between logarithmic and exponential functions to find key points with which to sketch the graph of a logarithmic function.
The graph of the parent logarithmic function has the following characteristics:
The domain is \left(0, \infty\right)
The range is \left(-\infty, \infty\right)
The x-intercept is at \left(1,\, 0\right)
No y-intercept
The vertical asymptote is x=0
- The function is increasing when b>1
- The function is decreasing when 0<b<1
Transformations of logarithmic functions
Logarithmic functions can be dilated, reflected, and translated in a similar way to other functions.
Translations can be categorized as horizontal (moving left or right, along the x-axis) or vertical (moving up or down, along the y-axis), or a combination of the two.
Vertical translations can be represented algebraically by g\left(x\right) = f\left(x\right) + kwhere k \gt 0 translates upwards and k \lt 0 translates downwards.
Similarly, horizontal translations can be represented by g\left(x\right) = f\left(x - h\right) where h > 0 translates to the right and h < 0 translates to the left.
Notice that a vertical translation does not affect the vertical asymptote but a horizontal translation does affect the vertical asymptote.
A reflection across the x-axis can be represented algebraically by g\left(x\right) = -f\left(x\right)A reflection across the y-axis can be represented algebraically by g\left(x\right) = f\left(-x\right)
Compressions and stretches are more generally called dilations.
Vertical dilations can be represented algebraically by g\left(x\right) = af\left(x\right)where 0 \lt \left|a\right| \lt 1 corresponds to a compression and \left|a\right| \gt 1 corresponds to a stretch.
Horizontal dilations can be represented algebraically by g\left(x\right) = f\left(cx\right)where \left|c\right| \gt 1 corresponds to a compression and 0 \lt \left|c\right| \lt 1 corresponds to a stretch.
For horizontal stretches and compressions, c=\dfrac{1}{\text{scale factor}}
The logarithmic parent function f\left(x\right)=\log_b\left(x\right) can be transformed to f\left(x\right)=a\log_b\left[c\left(x-h\right)\right]+kwith the correct values of a,\,b,\,h and k to apply transformations to f\left(x\right). When given a transformed function, we must convert it back to standard notation to correctly identify the transformations applied to the parent function.
We can use the relationship between an equation and its transformations to write equations and sketch graphs.
Examples
Example 4
The graph of the parent function is shown as a dashed curve. Write the equation of each transformed function.
Parent function: f\left(x\right) = \log_{\frac{1}{3}}x
Parent function: f\left(x\right) = \log_{4}x
Example 5
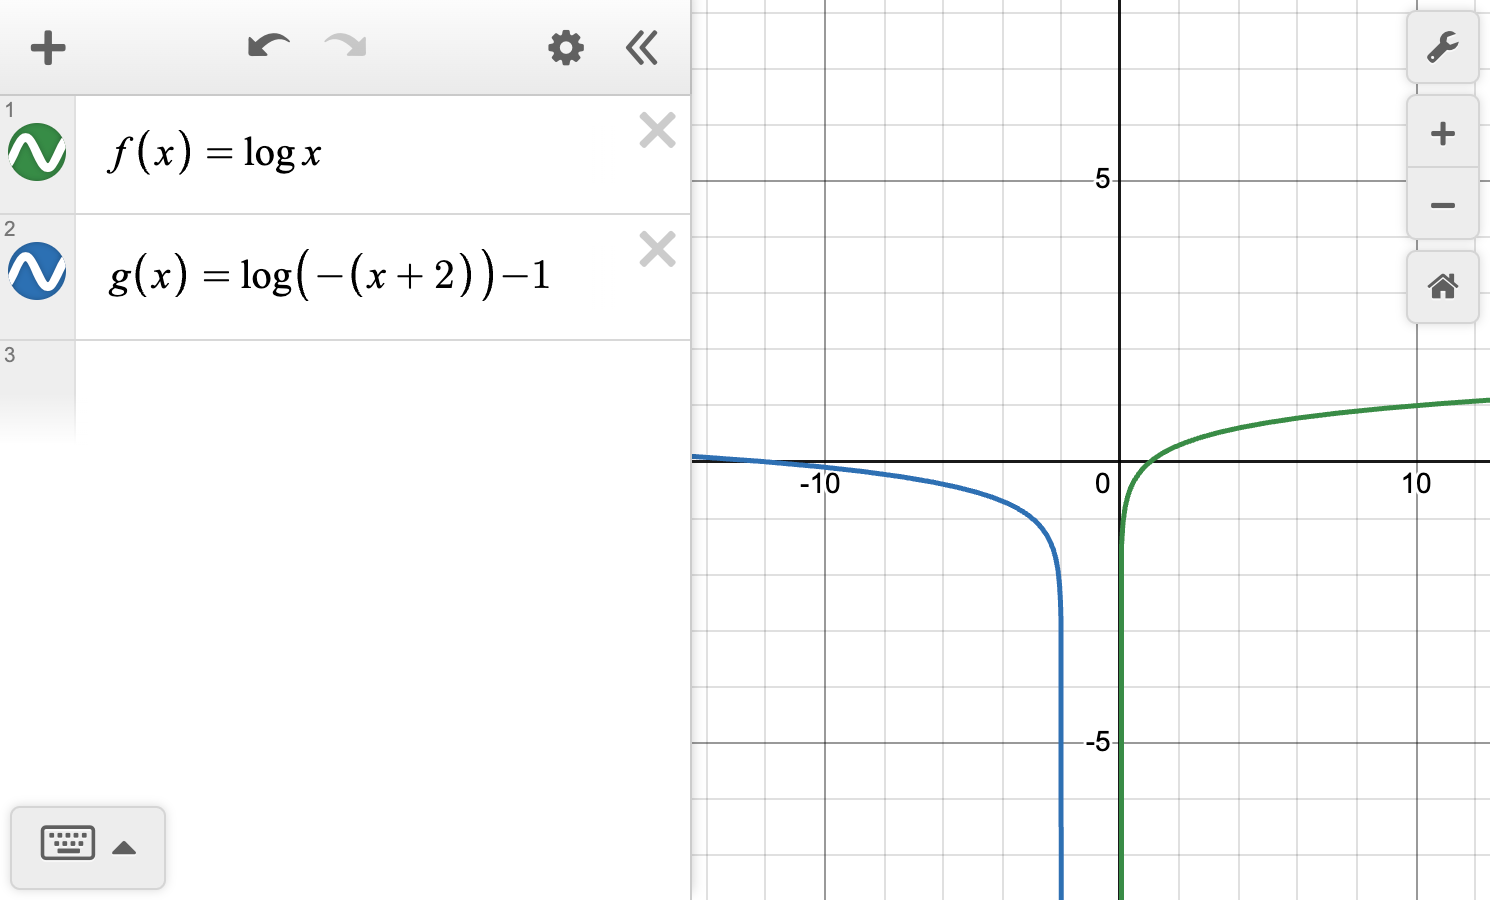
The graph of f\left(x\right)=\log\left(x\right) is shown.
Describe how g\left(x\right)=\log(-(x+2))-1 was transformed from f\left(x\right).
Graph g\left(x\right) on the same coordinate plane.
Identify and compare the asymptotes, zeros, and end behavior of f\left(x\right) and g\left(x\right).
The logarithmic parent function f\left(x\right)=\log_b\left(x\right) can be transformed to f\left(x\right)=a\log_b\left[c\left(x-h\right)\right]+k
If a<0, the basic curve is reflected across the x-axis.
The graph is vertically stretched or compressed by a factor of a.
If c<0, the basic curve is reflected across the y-axis.
The graph is horizontally stretched or compressed by a factor of c.
The graph is translated horizontally by h units.
The graph is translated vertically by k units.
