
7.02 Discrete random probability distribution
Our previous lesson introduced the concepts of random variables and defined the two categories, recall:
- A discrete random variable, or DRV for short, is when each outcome in a random experiment is assigned a discrete number.
- A continuous random variable, or CRV for short, is when the outcomes of a random experiment can take any value on a continuous interval.
An easy way to think about it is this: outcomes for a DRV are countable and outcomes for a CRV generally arise from variables we measure.
Now that we know the difference between a DRV and CRV, we want to take a closer look at DRVs, and in particular, we want to look at the distribution of their probabilities.
The probability distribution of a discrete random variable
For the probability distribution of a discrete random variable, each outcome is assigned a probability.
For example, let's say we toss a coin twice and we're interested in how many tails we see.
Firstly, we can define our DRV: Let $X$X be the number of tails in a two-coin toss.
We then know that $X$X can take on the values of $0$0, $1$1 or $2$2.
The probability distribution for $X$X will show us the probabilities for each of these outcomes. An easy way to do that for this example is to look at a tree diagram.

We'll now examine our tree diagram and tabulate the probabilities.
| $x$x | $0$0 | $1$1 | $2$2 |
|---|---|---|---|
| $P(X=x)$P(X=x) | $\frac{1}{4}$14 | $\frac{2}{4}$24 | $\frac{1}{4}$14 |
What we've just created is the probability distribution for the random variable $X$X.
Representations of a probability distribution for a DRV
A probability distribution consists of all the outcomes together with the probability of each outcome. There are a few ways to represent a probability distribution for a DRV:
- A table of values, with each outcome together with its probability.
- A function that describes how to obtain each probability over a given domain.
- A graph such as a column graph or spike graph with outcomes on the horizontal axis and height of the bars reflecting the probability.
The following table gives an example of the same probability distribution given in three different representations:
| Table | Function | Graph | ||||||||||
|---|---|---|---|---|---|---|---|---|---|---|---|---|
|
|
$P(x)=\frac{x}{10}$P(x)=x10 for $x=1,2,3,4$x=1,2,3,4. |
 |
A probability distribution for a discrete random variable must adhere to the following conditions:
- All outcomes are numerical and discrete.
- The probabilities of all possible outcomes must sum to $1$1 - this makes sense when you think about it, if they didn't all add up to $1$1 then we must be missing one of the outcomes or have one of the probabilities wrong.
- The probability $p$p of each outcome is greater than or equal to $0$0 and less than or equal to $1$1, that is, $0\le p\le1$0≤p≤1.
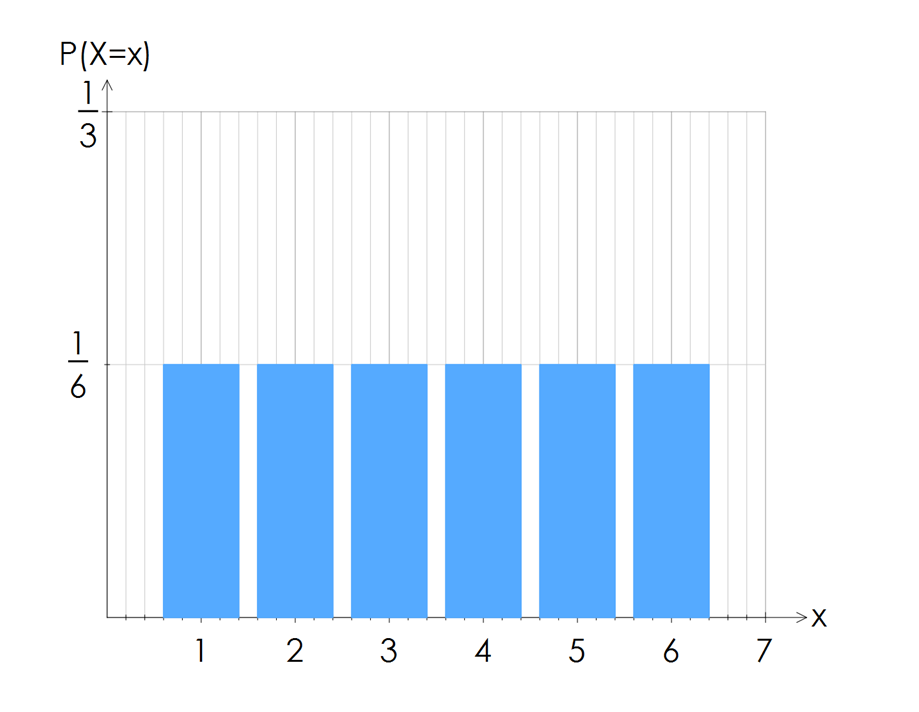
Uniform distribution
A special case of discrete probability distributions is the uniform distribution, where each outcome of the experiment is equally likely.
For example, when you roll a dice once, the probabilities of rolling a $1$1, $2$2, $3$3, $4$4, $5$5 or $6$6 are all equally likely, or uniform.
The graph of this probability distribution is shown below and we can observe each column is the same uniform height.
Practice questions
Question 1
Consider the following column graph.

Identify which conditions for a discrete probability distribution are evident in the column graph.
Select all that apply.
$X$X is discrete numerical
A$\Sigma P\left(x\right)=1$ΣP(x)=1
B$0\le P$0≤P$\left(x\right)\le1$(x)≤1
CTherefore, does this graph represent a discrete probability distribution?
Yes
ANo
B
Question 2
Consider the following function $P(X=x)=-\frac{x}{3}$P(X=x)=−x3 for $x=1,2,3$x=1,2,3.
Complete the table.
$x$x $1$1 $2$2 $3$3 $P(X=x)$P(X=x) $\editable{}$ $\editable{}$ $\editable{}$ Does this table represent a discrete probability distribution?
Yes
ANo
B
Question 3
The probability function for a discrete random variable is given by:
| $P$P$($($X=x$X=x$)$) | $=$= |  |
$k\left(9-x\right)$k(9−x); $x=4,5,6,7,8$x=4,5,6,7,8 |
| $0$0, for all other values of $x$x |
Determine the exact value of $k$k.
Hence complete the table of values.
$x$x $4$4 $5$5 $6$6 $7$7 $8$8 $P$P$($($X=x$X=x$)$) $\editable{}$ $\editable{}$ $\editable{}$ $\editable{}$ $\editable{}$ Calculate $P$P$($($X<7$X<7$)$).
Calculate $P$P$($($X\ge6$X≥6$)$).
Calculate $P$P$($($X<6$X<6$\cup$∪$X>7$X>7$)$).
Calculate $P$P$($($X\ge5$X≥5$|$|$X\le7$X≤7$)$).
Question 4
The probability function for a uniform discrete random variable is given below:
| $P$P$($($X=x$X=x$)$) | $=$= | |
$k$k; $x=1,2,3,4$x=1,2,3,4 |
| $0$0, for all other values of $x$x |
Determine the value of $k$k.
Calculate $P$P$($($X<3$X<3$)$).
Calculate $P$P$($($X\ge2$X≥2 $|$| $X<4$X<4$)$).
Determine $m$m such that $P$P$($($X\ge m$X≥m$)=0.75$)=0.75.