
How probability can save lives: Medical testing
Doctors use probability regularly in deciding whether it is worth "screening" patients for medical conditions. Screening refers to testing people who do not have any symptoms, just in case they have a disease which could be treated. Whilst screening can be life-saving if used correctly, it can also go terribly wrong if used in the wrong circumstances.
Screening for cancer
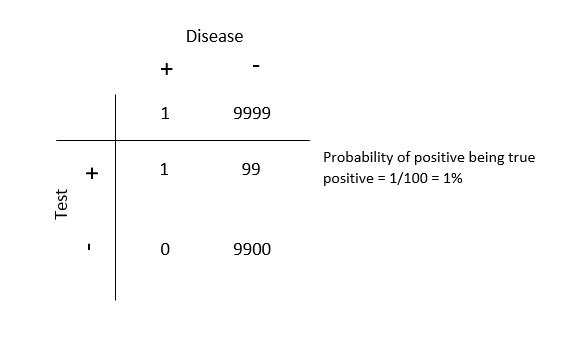
A key example is the use of tumour markers to check if someone has cancer. For example, imagine that around 1 in 10000 asymptomatic people have pancreatic cancer, and there is a blood test which is 99% accurate in detecting pancreatic cancer.
- If you do this test, and you get a positive result, what do you think your chance of having cancer is?
Most people answer 99%. After all, the test is "99% accurate" right? In fact, the answer to this question is only around 1%. How can that be possible? It all comes down to probability.
To see how this works, imagine 10000 people who get tested for pancreatic cancer. Statistically, only 1 person out of these 10000 will have pancreatic cancer, so there will only be only 1 true positive result. However, since the test has a 1% error rate, amongst the 9999 people who get the test there will be 99 false positives (defined as people who do not have cancer but get a positive result anyway). Therefore, there will be 1 true positive and 99 false positives. This means that anyone who gets a positive result has a 99% chance that the result is a false positive, and only a 1% chance that it is a true positive.
To make it easier to see, we can make a table of these numbers:
These false positives might seem harmless, but they often result not only in anxiety for the patient but may also result in potentially harmful interventions such as scanning with radiation or unnecessary surgery. Therefore, doctors generally do not use tumour markers to check if people have cancer.
Screening for STIs
In Australia, all sexually active young people (15 - 29 years old) are advised to have a screening test for Sexually Transmitted Infections. Chlamydia is Australia's most common STI, with a prevalence in young people of around 1 in 20, and can lead to infertility and life-threatening ectopic pregnancy.
- If the screening test for Chlamydia is 99% accurate, what is the chance of a positive test result being a true positive? Make a table like the one above to find out. Do you think this makes universal screening for Chlamydia appropriate?
Screening for depression
The prevalence of clinical depression in young people is around 7%, making it the single most common serious medical condition amongst young people. Whilst there are many excellent treatment options available in Australia, including services like Mood Gym specifically targeted at young people, depression often goes unrecognised and people do not think to go to the doctor for it. Depression can be diagnosed using the PHQ-9 questionnaire, where a score of 11 or more (or thoughts of suicide alone) has an accuracy of around 80% for diagnosing clinical depression.
- Make another table to figure out the chance of a positive test on the PHQ-9 questionnaire being a true positive. Do you think this makes universal screening for depression appropriate?
How probability can save you money: Insurance premiums
As a high school student, you may already be driving, or be thinking about driving soon. As such, you may well be aware how expensive car insurance can be for a young person.
- See how much you would pay for comprehensive car insurance per year if you were to drive your parents' car, using an online insurance calculator or look at average prices in different states for your age group here.
Why is it so expensive? Do you notice the difference between the cost for younger or older drivers? Males versus females? Insurers know that young people, in particular young males, are at much higher risk than older adults of having a car accident. For example, the graph below shows the rate of hospitalisations per 100000 people from a report published by Australian Institute of Health and Welfare in 2018.

Age-specific rates for hospitalised injury cases due to on-road crashes by age and sex in 2014–15
- What do you think are the factors which make younger drivers so much more likely to have a car crash?
In calculating your insurance premium (how much you pay for insurance), insurers want to ensure they are charging you the right price. If it is too expensive, you will end up getting insurance with another company instead. If it is too cheap, then the insurance company will end up losing money because the costs of car crashes will be more than the money they make from car insurance.
In trying to figure out the "right price" for insurance, the insurance companies hire an "actuary". Actuaries are part of the mathematical elite, using complex probability calculations to figure out the long-term risk of events like car crashes or natural disasters happening. Having such useful mathematical skills makes actuaries highly sought-after by a range of companies, and the profession has been rated as the best job of 2013 based on its high income, good work environment and balanced lifestyle.
Whilst we won't get into the real-life complex calculations, let's make our own simple model and see how well it works.
- How much do you think your parent's car is worth?
- What is your risk of a major car crash per year? Use the tables below to calculate the approximate yearly risk of a car crash for your age group.
This table shows the number of crashes per age group:
![]()
This table shows the number of licence-holders per age group:
![]()
- Multiply your risk by the estimated cost of the crash. To keep it simple, we'll assume that the cost of the crash is simply the cost of replacing your car.
- The number you have is the approximate amount of money that an insurance company would need to charge to "break even" on your insurance policy. How does it compare with the figure you got from the actual insurance calculator? Can you think of why the two numbers would be different? What costs does your estimate not include?
What happens if you drive below the speed limit?
Recently, some insurance companies have started to offer an interesting deal for drivers. If you agree to have a "black box" put in your car, the insurance company can gather data on your driving habits, and charge you insurance premiums according to how you drive. Let's calculate how knowing your driving habits might allow you to have cheaper insurance.
A recent Road and Maritime Services paper points out that "In urban areas, exceeding the speed limit by 5 km/h doubles the likelihood of a casualty crash and each additional increase in speed by 5 km/h further doubles the risk". Speeding contributes to around 40 percent of fatal crashes. If we extrapolate this to non-fatal crashes as well, we could argue that you can reduce your risk of a crash by around 40 percent if you do not speed.
Let's say that your "black box" shows that you never exceed the speed limit.
- If we assume that this reduces your risk of crashes by 40 percent, what is your new risk of a car crash?
- Using the previous method of calculating insurance premiums, what would your insurance premium be now?
- If the black box shows that your driving habits are identical to an older driver, should you receive the same insurance premium as them? Why or why not?
- If "black boxes" became popular, what would happen to the insurance premiums of drivers who did not sign up for a "black box"?
- Would you want to sign up for a black box for your car insurance? Why or why not?
- Are there any other things that insurance companies could do to identify young drivers who are at lower risk, to reduce the cost of their insurance?
How mathematics can get you a job
- Have a look at the list of careers on weusemath.org, and see if you can find another job where you think probability would play an important role in decision making. How do you think probability would be used in this setting?